Method
1. Method Overview
이 페이지는 GeoSignal Preview에서 사용하는 계산 흐름과 해석 방식을 설명합니다.
GeoSignal Preview는 production-level lithography simulator나 calibrated wafer prediction model을 목표로 하지 않습니다. 대신 layout geometry에서 먼저 후보 영역을 찾고, 선택된 ROI에 대해 simplified optical model 기반 aerial image와 threshold contour를 생성하여 lithography-aware 관점의 형상 변화를 빠르게 확인하는 preview workflow입니다.
기본 method flow는 다음과 같습니다.
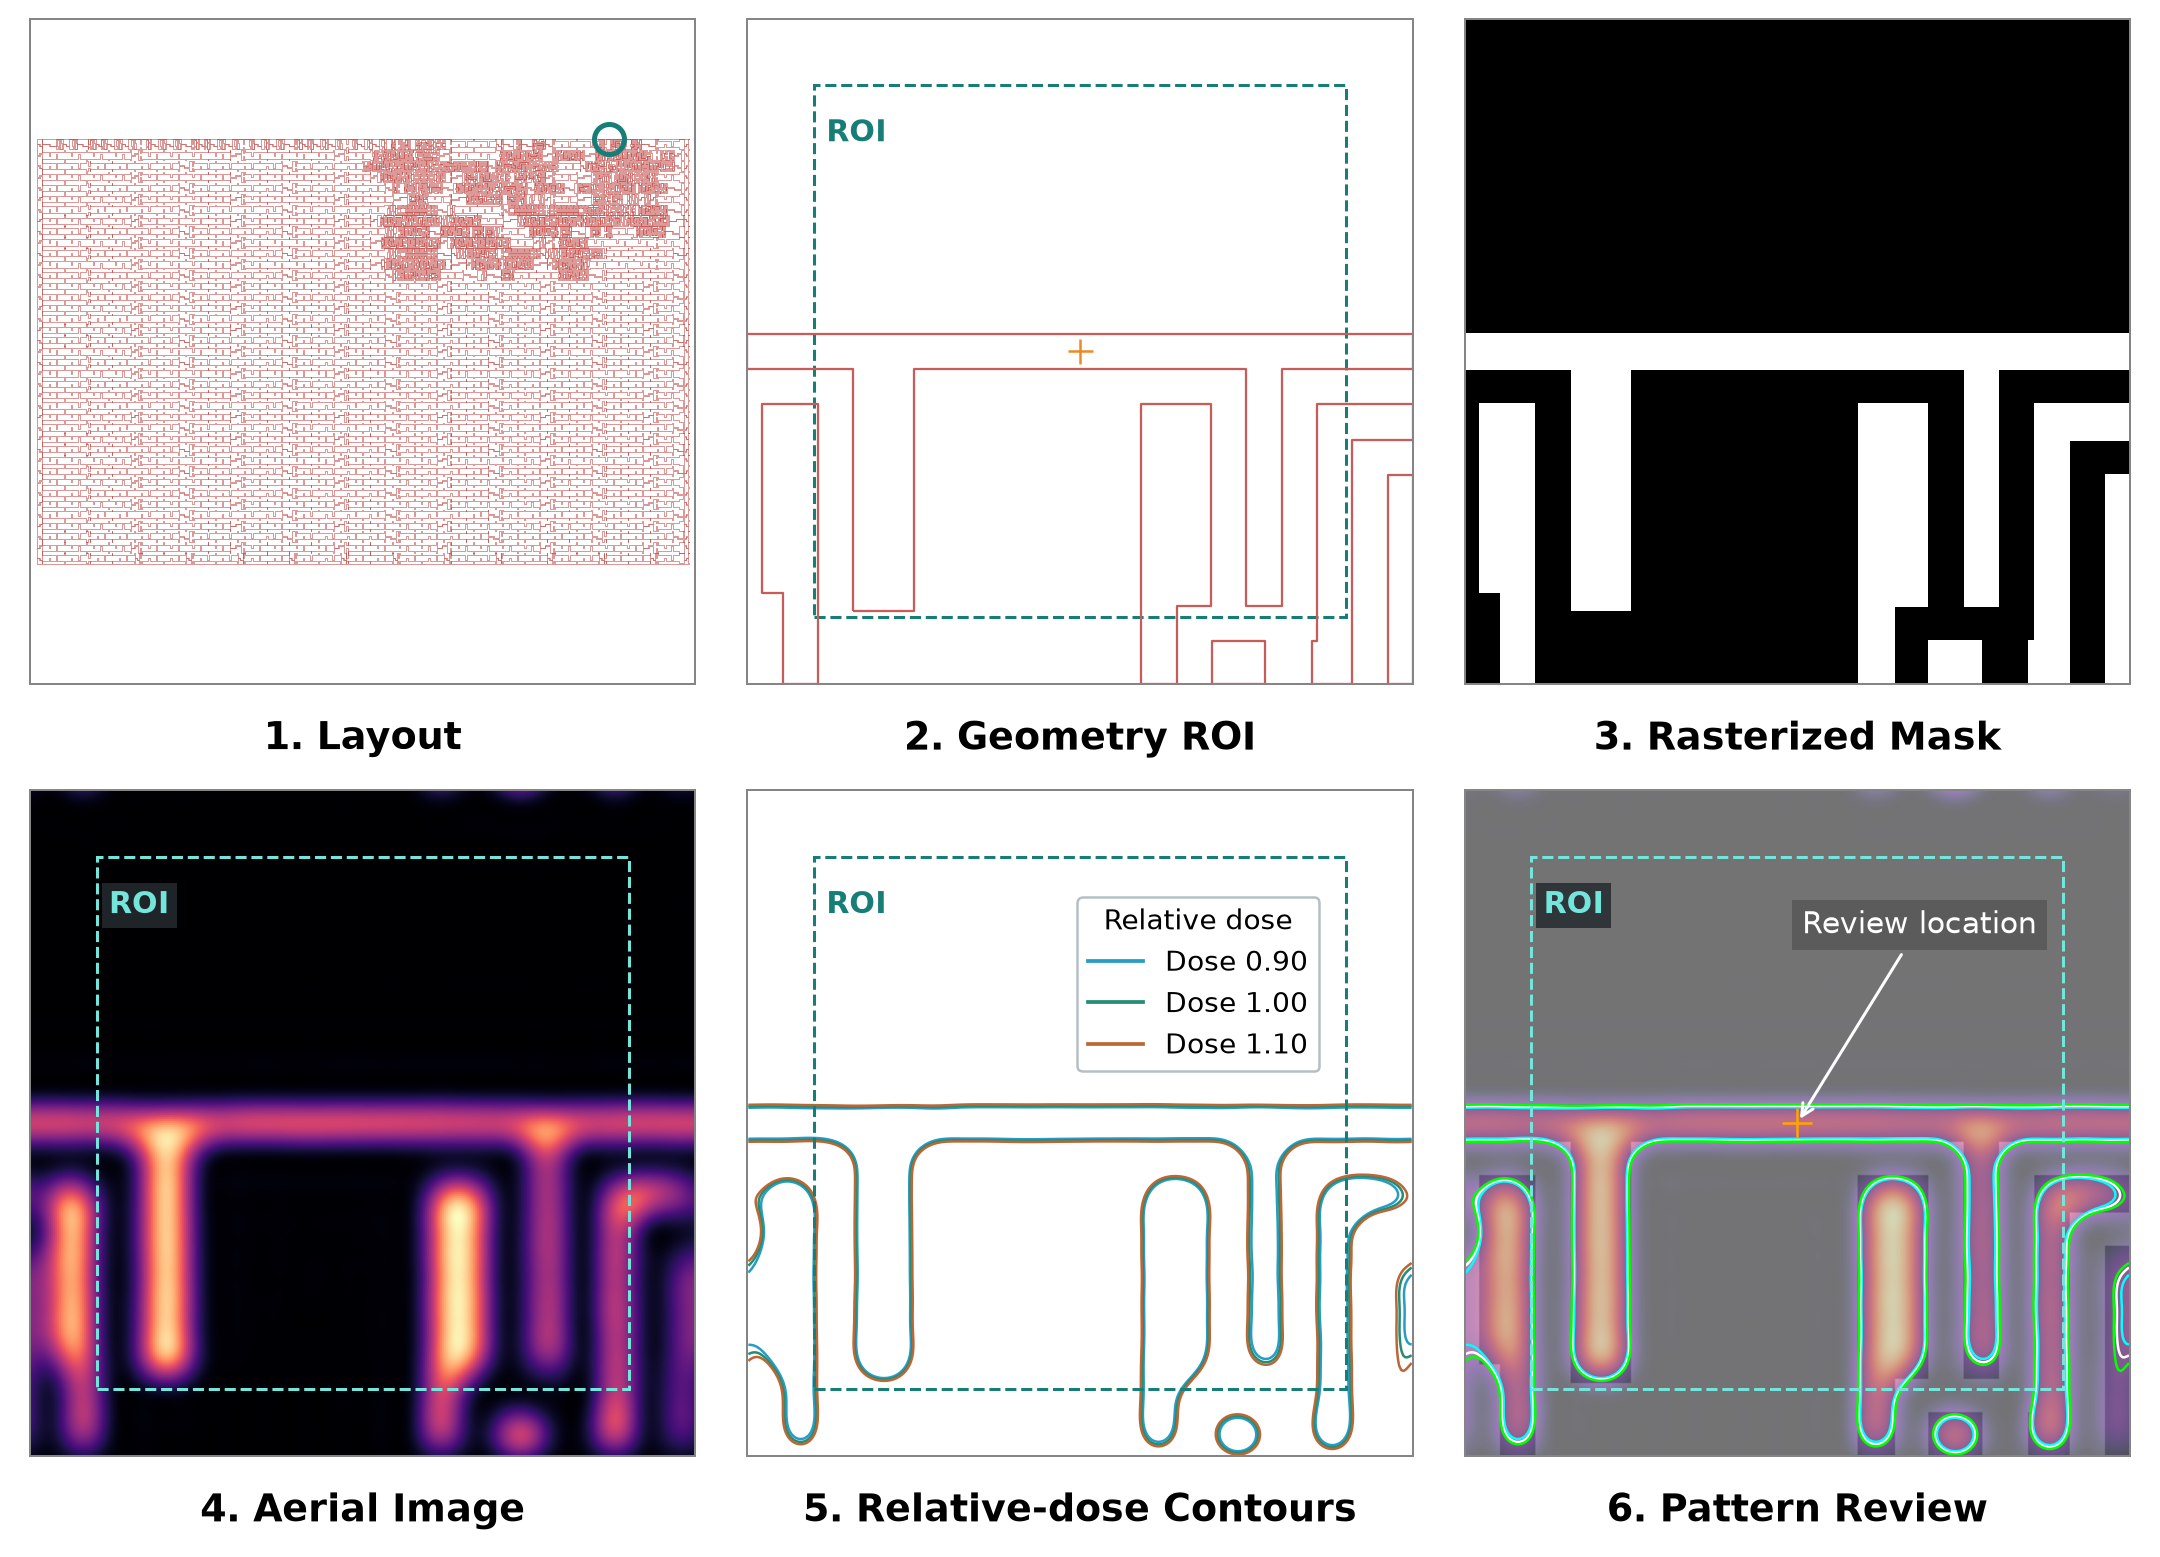
동일한 67/20 폭 후보를 선택한 뒤 마스크, 빛의 분포, 상대 도즈별 윤곽으로 이어지는 흐름입니다. 표시된 위치는 검토 후보이며 확정된 불량이 아닙니다. Focus/Dose 비교는 이후 선택 단계입니다. Demo 사례에서 확인할 수 있습니다.
점선은 2.56 × 2.56 µm inner ROI입니다. 2–6번 그림은 각 변 바깥의 광학 여유 폭 0.32 µm를 포함한 3.20 × 3.20 µm 범위를 보여줍니다. 1번은 전체 레이어입니다. 윤곽은 상대 도즈 0.90·1.00·1.10을 비교합니다.
모든 layout 영역에 대해 optical simulation을 수행하는 것이 아니라, geometry 기준으로 후보를 먼저 좁힌 뒤 선택된 ROI에 대해서만 optical-response visualization을 계산합니다.
버전별 구현 세부 내용은 릴리즈 노트로 분리해 이 페이지가 method 개념에 집중하도록 했습니다.
현재 계산은 Abbe 광학 모델을 사용합니다. 다른 계산 방식과의 교차검증 등 버전별 세부 내용은 v0.10 릴리즈 노트에서 확인할 수 있습니다.
2. Candidate ROI Selection
ROI는 선택한 위치 주변의 작은 검토 영역입니다. Width는 선의 폭, space는 선 사이의 간격을 뜻합니다.
첫 번째 단계는 layout geometry에서 후보 ROI를 선택하는 것입니다.
현재 demo에서는 minimum width / space 관점에서 후보 영역을 먼저 찾고, 그중 일부를 optical contour review 대상으로 선택합니다.
이 단계는 다음과 같이 이해하는 것이 적절합니다.
최종 hotspot 판정
    X

optical contour review를 위한 1차 geometry-based filtering
    O
중요한 것은 현재 후보 선정 기준 자체가 최적이라는 점이 아니라 다음과 같은 구조입니다.
layout geometry에서 잠재적으로 취약한 위치 탐색
    -> 해당 위치의 optical response 계산
    -> threshold contour를 통한 형상 거동 검토
후보는 폭·간격이 작은 순서로 살펴보고, 같은 값이면 병합된 후보 영역이 큰 곳을 먼저 선택합니다. 구체적인 검사 기준과 평가 결과는 v0.10 릴리즈 노트에 정리했습니다.
3. ROI Rasterization
Candidate ROI가 선택되면, 해당 ROI 내부의 layout polygon을 rasterized mask image로 변환합니다.
polygon 내부  -> 1
polygon 외부  -> 0
즉, layout geometry를 regular pixel grid 위의 binary mask로 변환하는 단계입니다.
Layout polygons in ROI
    -> Pixel grid
    -> Binary mask image
Rasterized mask는 optical imaging calculation의 입력이 됩니다.
현재 preview에서는 mask를 PSM-aware mask model이 아니라 binary mask 기준으로 계산합니다. Phase-shift mask 효과, attenuated mask transmission, 상세 mask stack 효과는 포함하지 않습니다.
Pixel size는 해상도와 계산량 사이의 trade-off를 결정합니다. Pixel size가 작으면 layout detail을 더 정확하게 표현할 수 있지만 image array와 FFT 계산 비용이 증가합니다. Pixel size가 크면 runtime은 줄지만 작은 geometry detail을 잃을 수 있습니다.
ROI에는 후보 위치 주변 margin이 포함될 수 있습니다. Optical response가 candidate polygon 자체뿐 아니라 주변 layout structure의 영향도 받기 때문입니다.
4. Abbe-based Aerial Image Calculation
GeoSignal Preview는 현재 Abbe 기반 simplified imaging approach를 사용합니다.
Aerial image는 rasterized mask에 simplified optical imaging model을 적용하여 얻은 optical intensity map입니다.
이 이미지는 다음에 가깝습니다.
optical response image
다음으로 해석하면 안 됩니다.
final wafer contour
calibrated resist contour
production CD prediction
계산 흐름은 개념적으로 다음과 같습니다.
Rasterized mask
    -> Mask spectrum
    -> Source point sampling
    -> Shifted pupil filtering
    -> Coherent image per source point
    -> Partially coherent aerial image
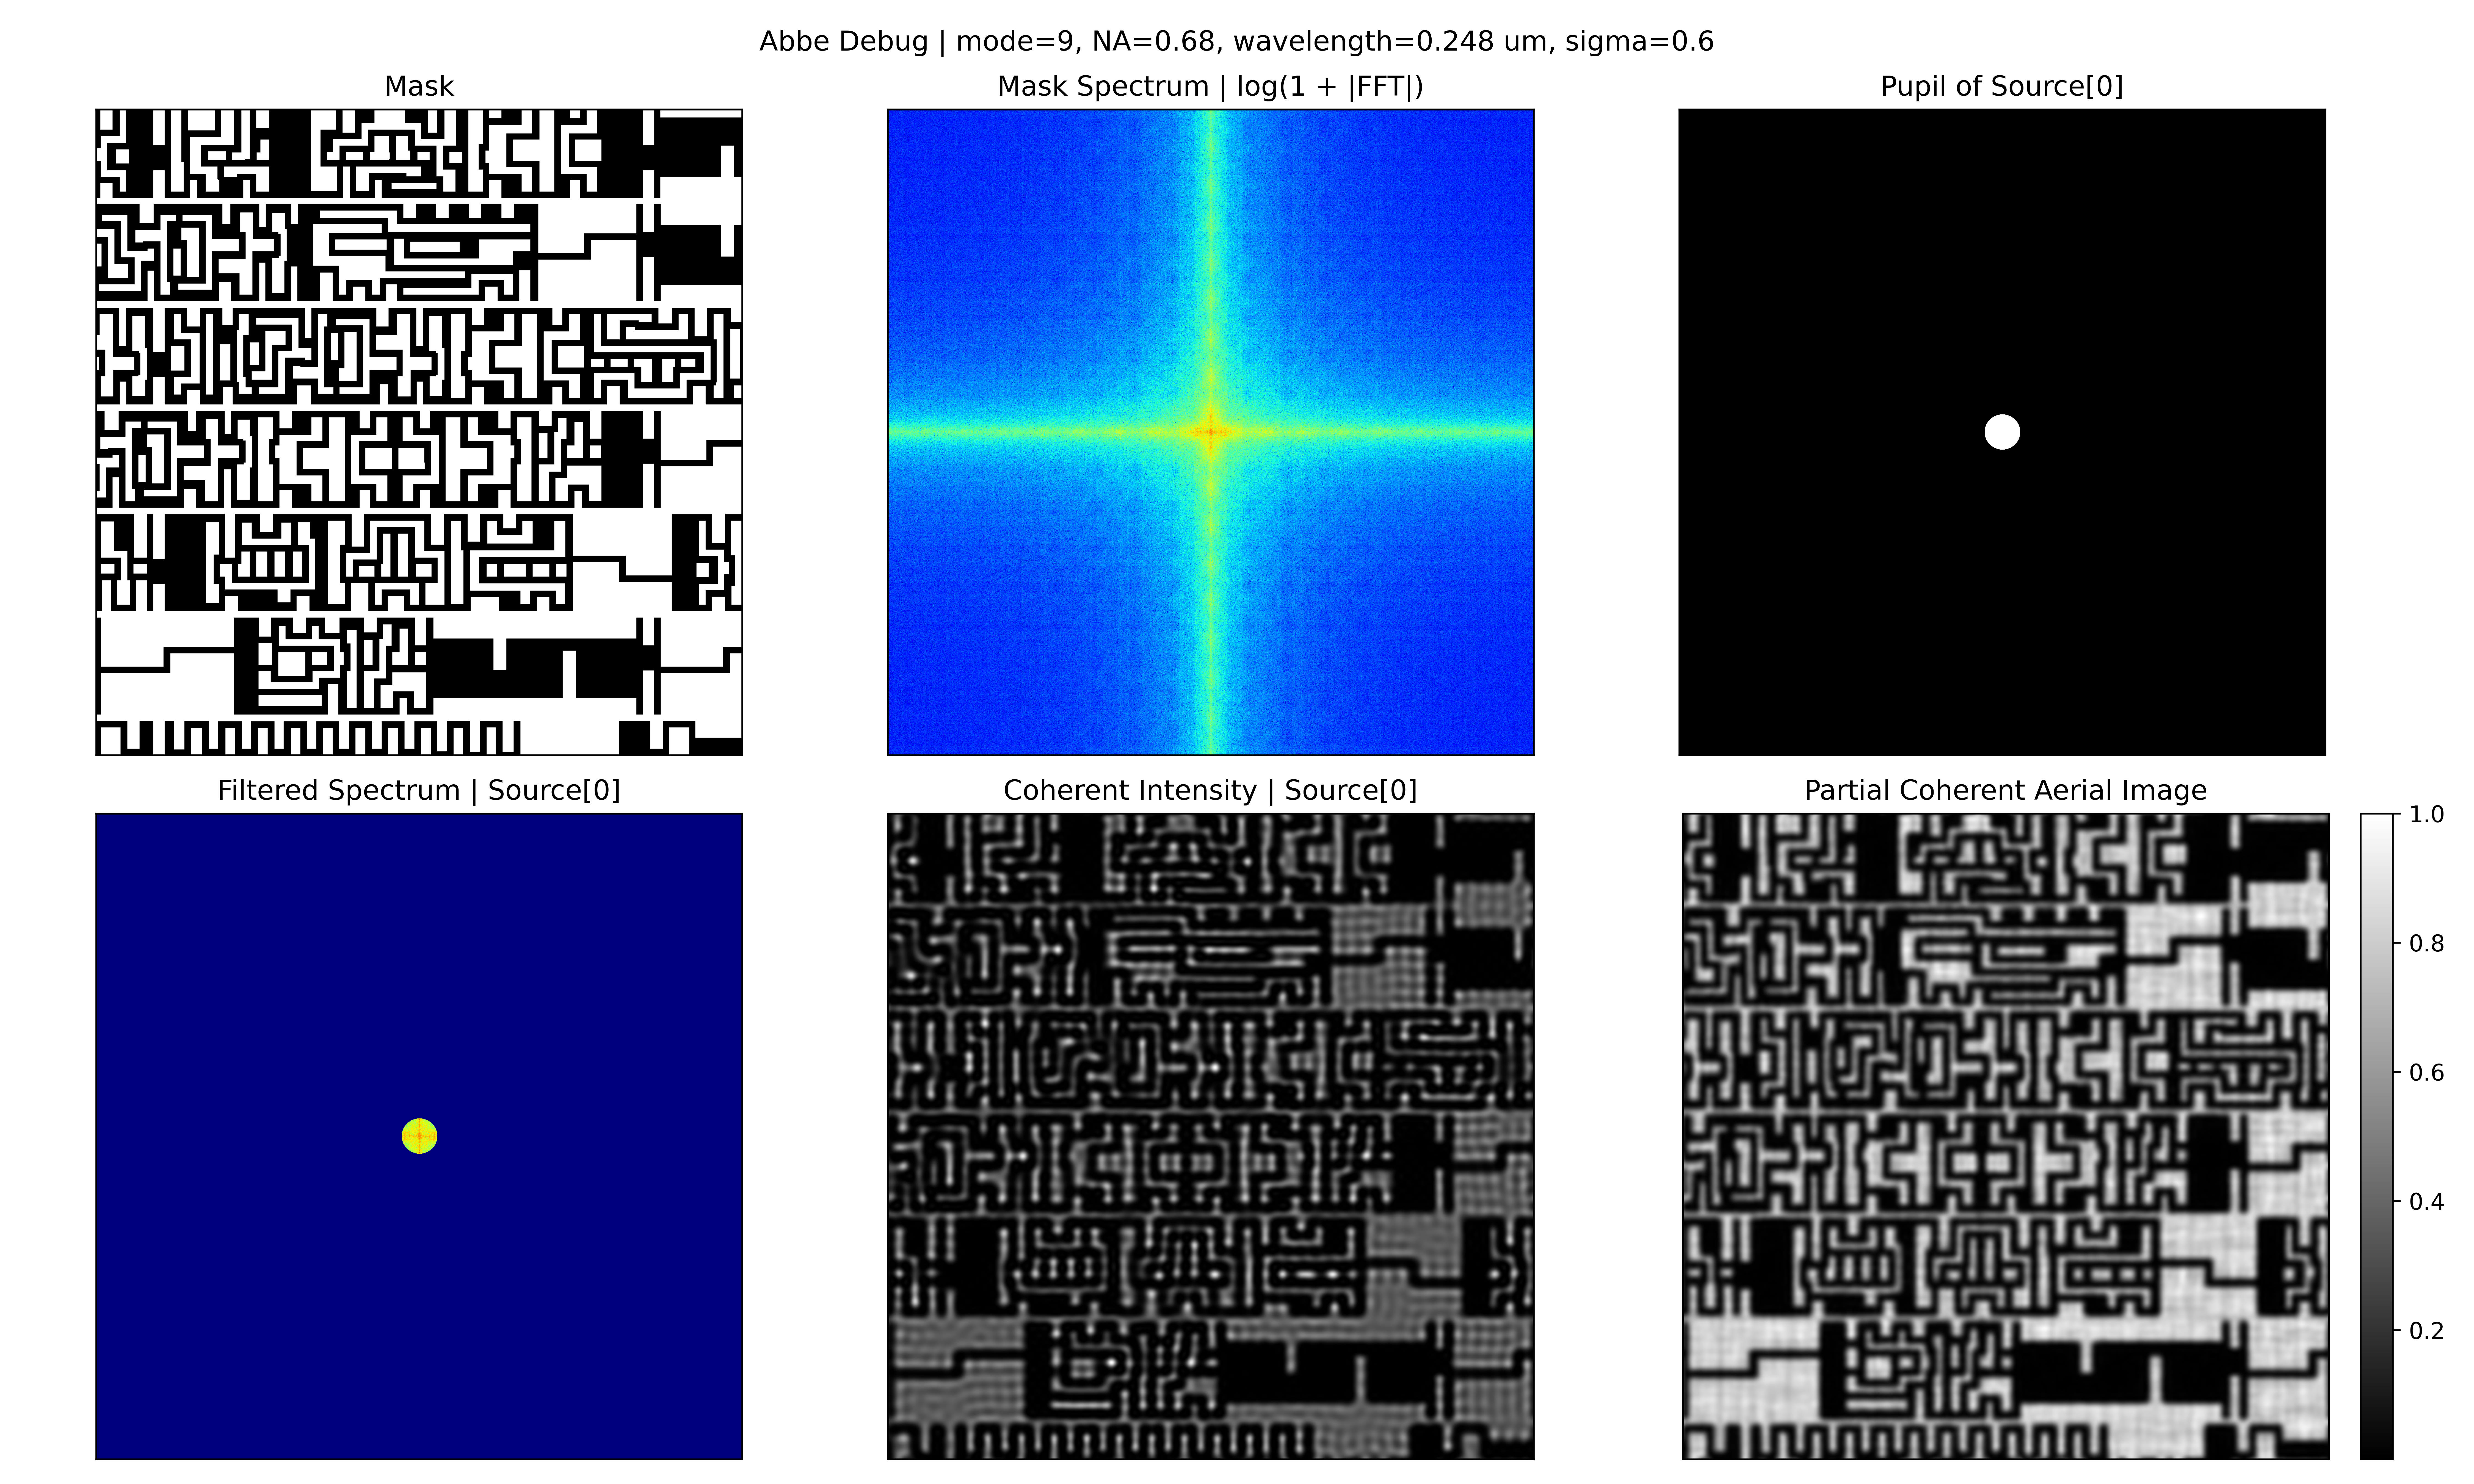
보다 구체적인 과정은 다음과 같습니다.
- Rasterized mask를 frequency domain으로 변환합니다.
- 각 source point에 따라 pupil 위치를 shift합니다.
- Shifted pupil로 mask spectrum을 filtering합니다.
- Filtered spectrum을 image domain으로 되돌립니다.
- 각 source point의 coherent intensity image를 계산합니다.
- Coherent intensity image를 누적해 final aerial image를 만듭니다.
아래 이미지는 9-point source 조건에서 Abbe-style aerial image 계산 흐름을 보여주는 debug example입니다.
아래 이미지는 더 dense한 source sampling 조건에서 동일한 계산 흐름을 확인한 예시입니다.
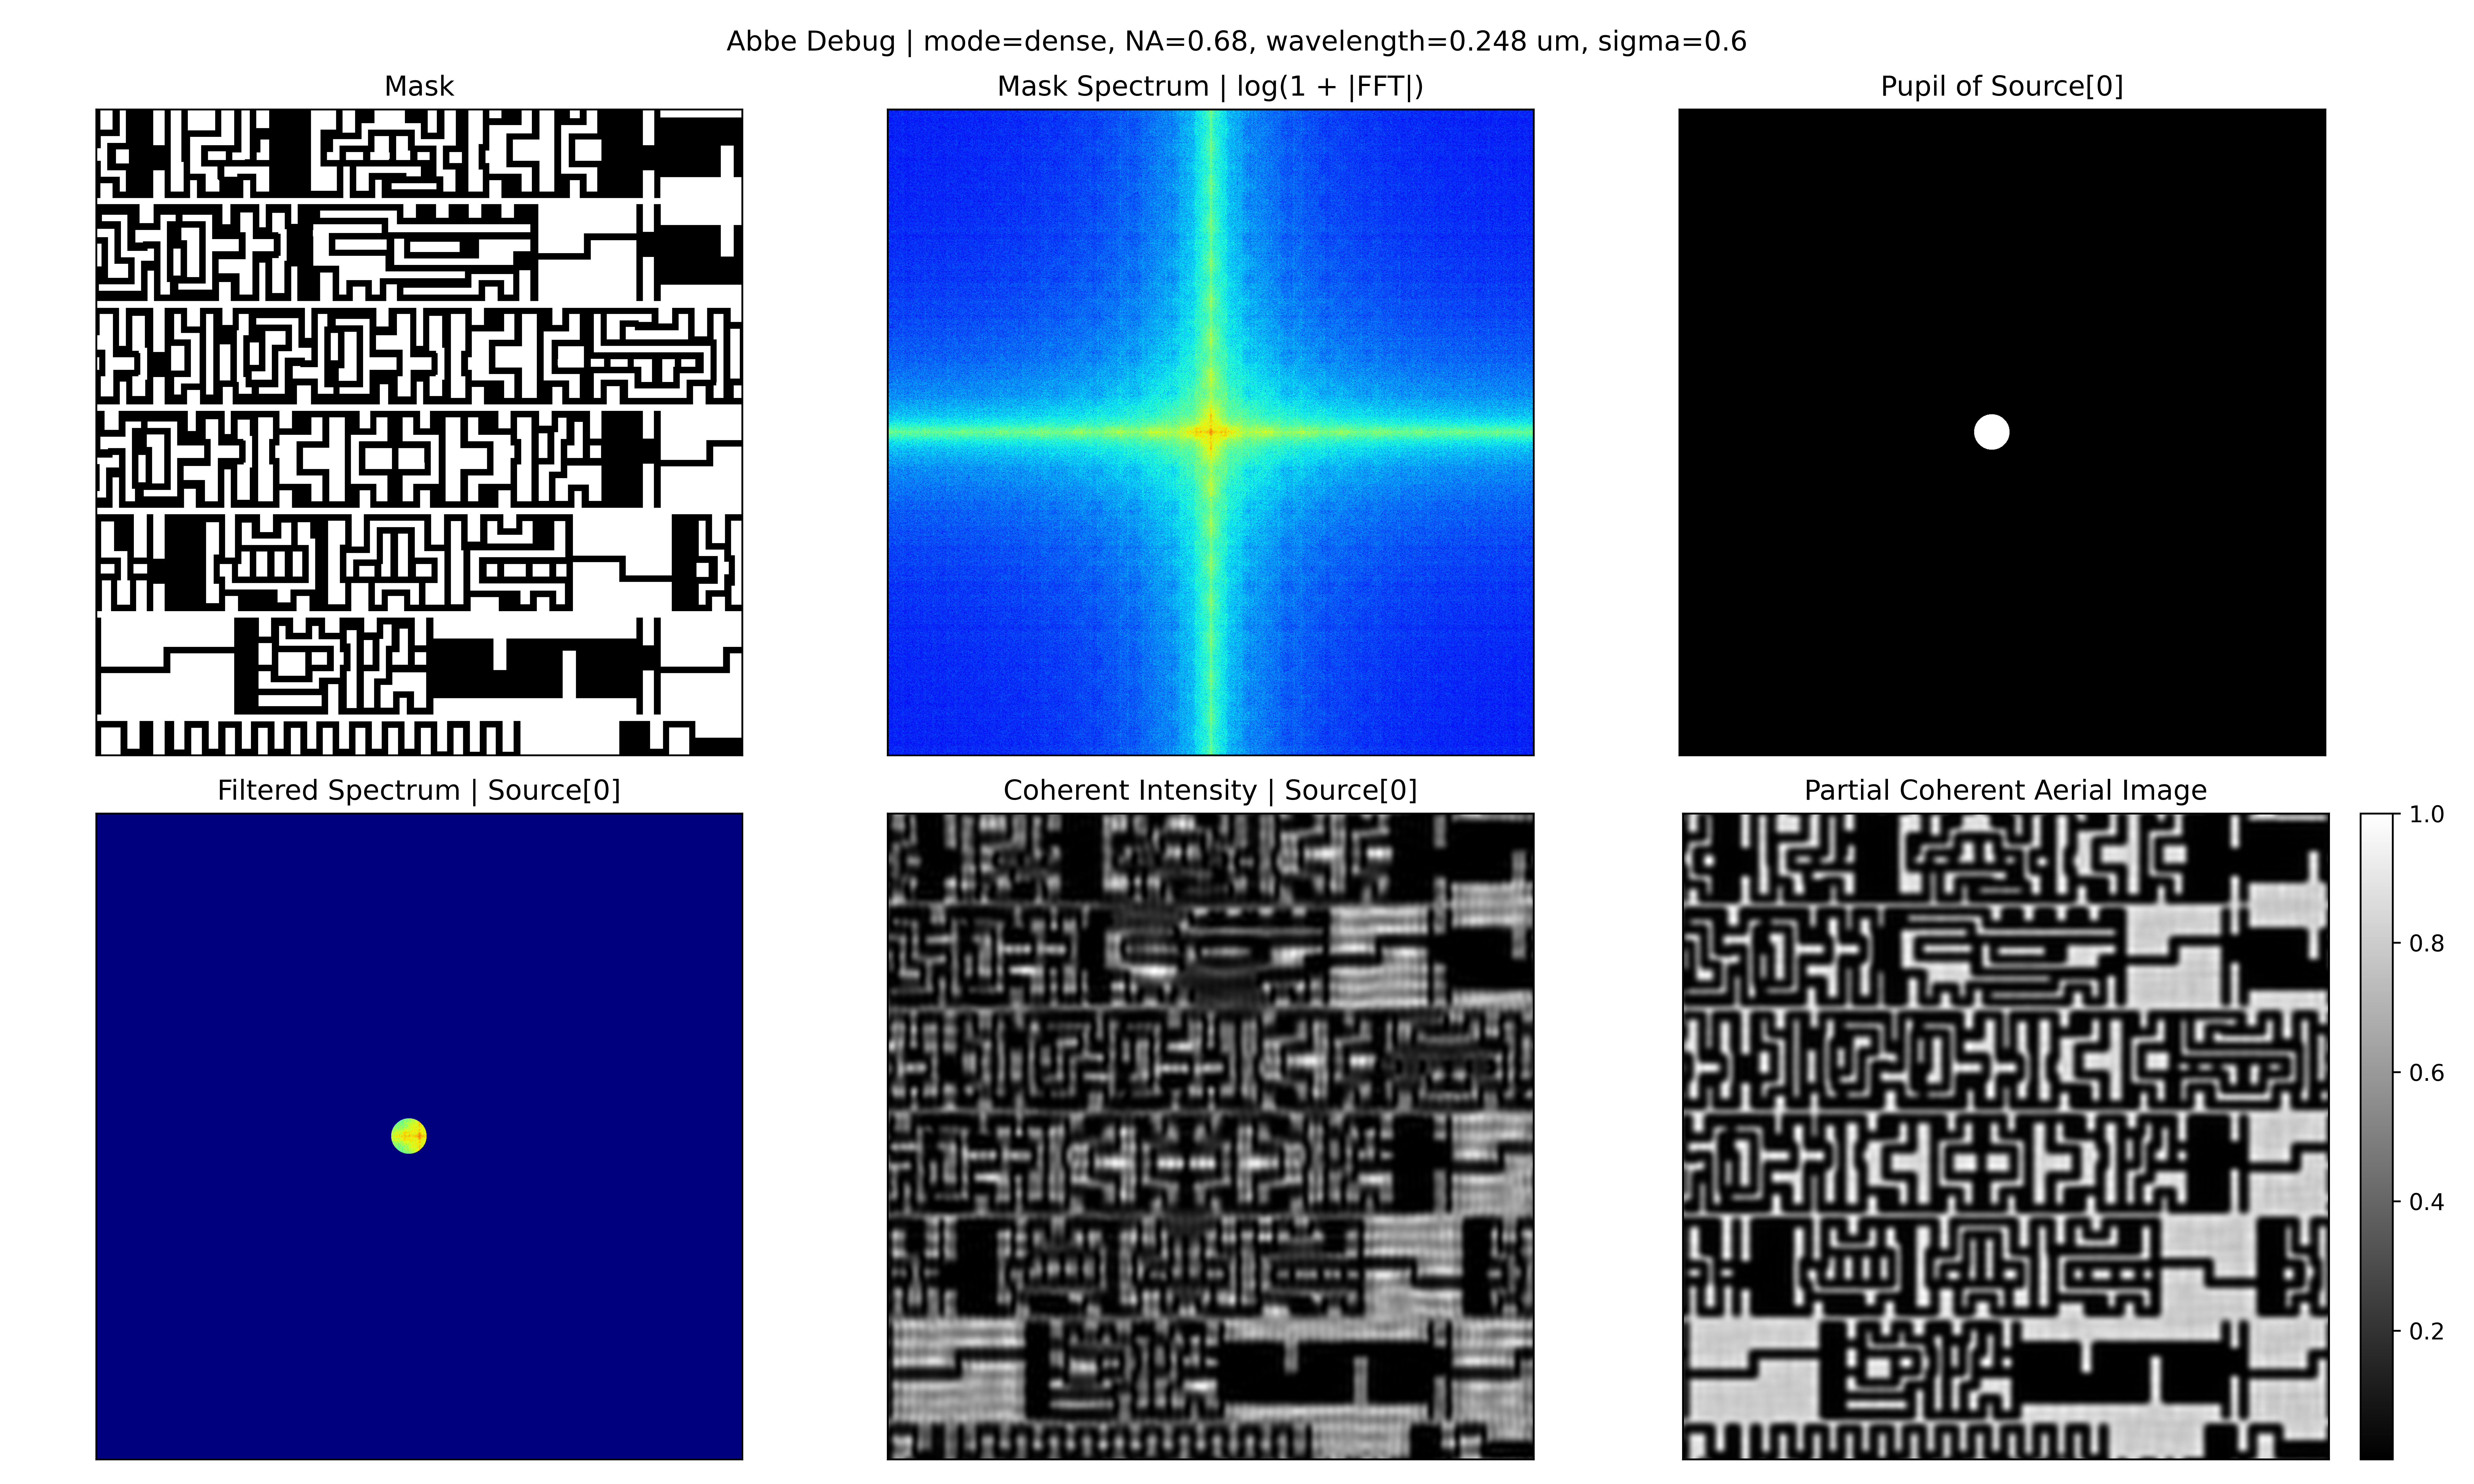
이 이미지는 method 이해를 위한 visual reference이며, calibrated scanner-model validation은 아닙니다.
Aerial image에서는 다음과 같은 효과를 정성적으로 확인할 수 있습니다.
- edge blur
- corner-rounding-like response
- line-end-pullback-like response
- narrow region 주변 intensity degradation
- neighboring pattern 간 optical interaction
- dense structure와 isolated structure의 response 차이
5. Source Sampling and Pupil Filtering
Illumination source는 여러 source point를 sampling하는 방식으로 근사합니다.
각 source point는 하나의 illumination direction을 나타냅니다. 각 source point에 대해 pupil을 frequency domain에서 shift하고, shifted pupil을 통과하는 spatial-frequency component만 사용해 image contribution을 재구성합니다.
Source point
    -> Shifted pupil
    -> Filtered mask spectrum
    -> Coherent image contribution
Source point가 많아지면 illumination approximation은 더 부드러워질 수 있지만 계산 시간이 증가합니다. Source point가 적으면 runtime은 줄지만 sampling condition에 더 민감해질 수 있습니다.
Final aerial image는 sampling한 모든 source point의 image contribution을 누적해 얻습니다.
아래 이미지는 source-sampling condition을 비교합니다.
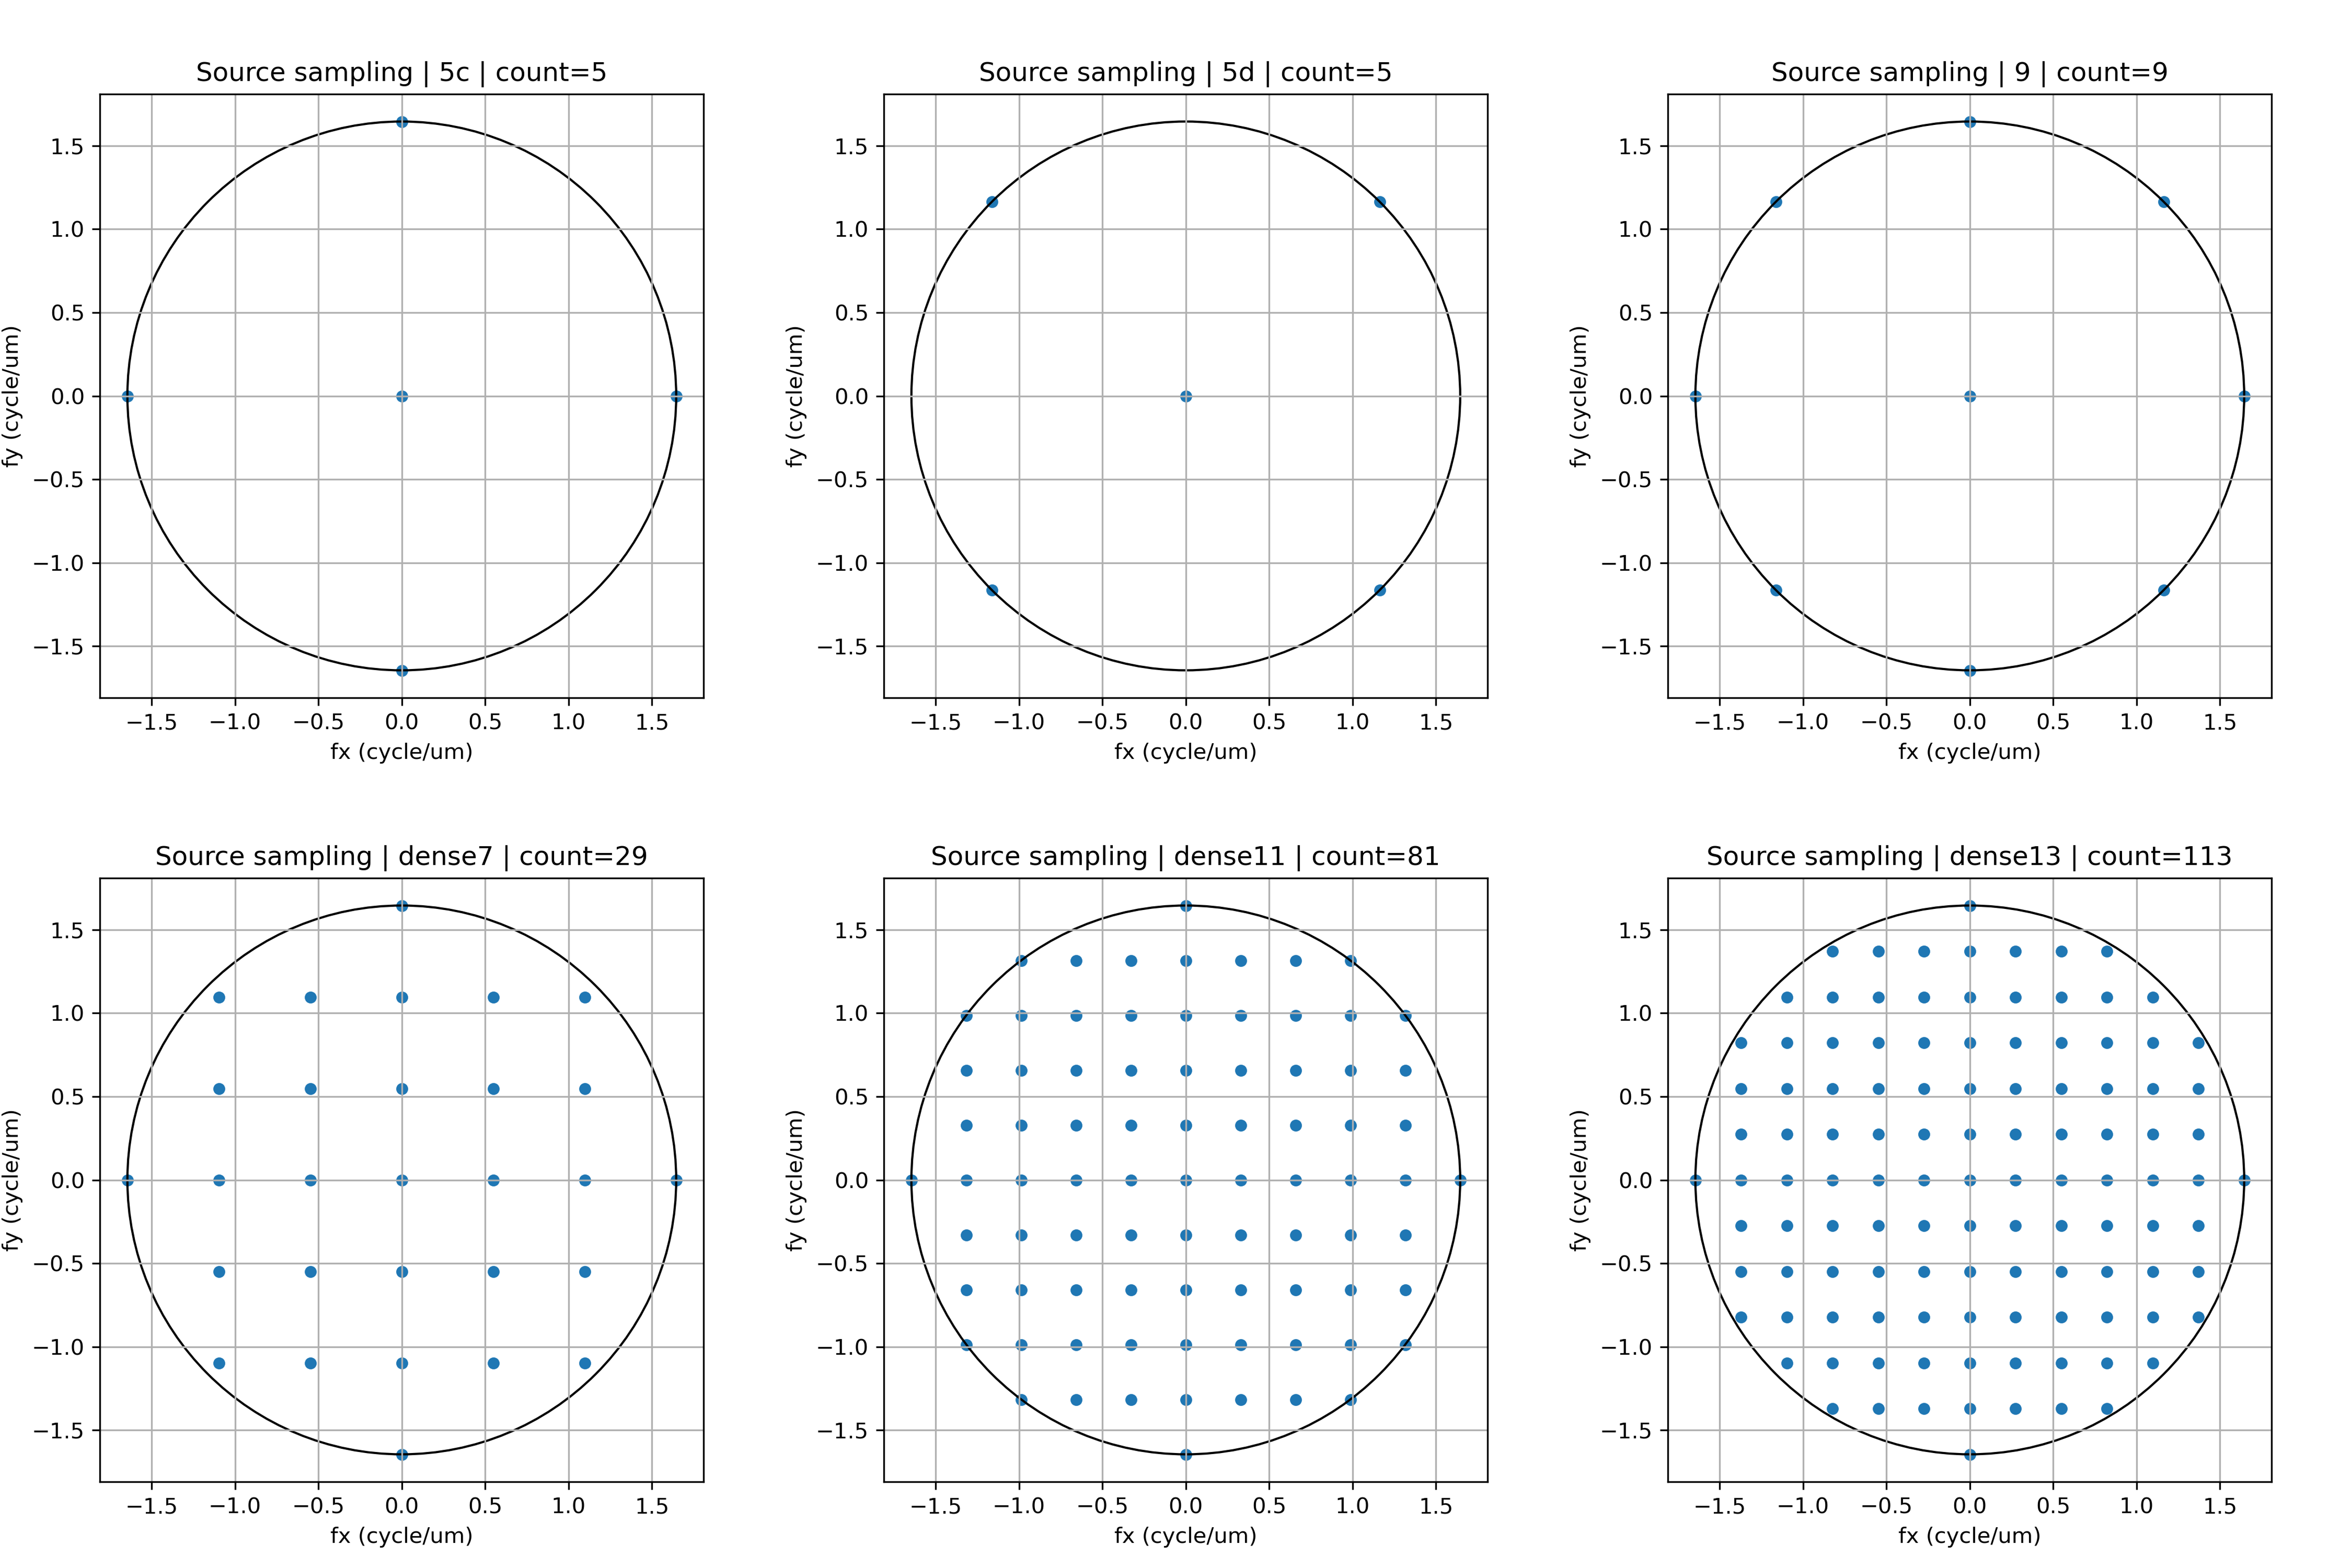
현재 preview에서는 visual stability와 computational cost를 함께 고려해 source-sampling condition을 선택합니다. 최근 default 선택의 상세 근거는 release notes에 정리했습니다.
현재 결과는 scanner-calibrated lithography model이 아니라 정성적 optical-response visualization로 해석해야 합니다.
6. Relative-dose Contour Extraction
Aerial image는 계산한 빛의 분포입니다. 여기에서 기준을 넘는 영역의 경계선을 그린 것이 contour입니다. 회색 원래 도형과 이 윤곽을 겹쳐 보면 빛의 영향으로 모양이 어떻게 달라지는지 살펴볼 수 있습니다.
계산한 빛의 분포
    -> 기준 패턴으로 비교 출발점 설정
    -> 빛의 양을 바꾸어 윤곽 비교
현재는 기준 패턴의 설계 폭에 모델을 맞춘 다음 빛의 양을 기준 대비 −10%, 기준, +10%로 비교합니다. 빛의 양을 바꾸어도 모델의 재료 기준 자체를 바꾸는 것은 아닙니다. 실제 웨이퍼를 측정해 맞춘 공정 모델도 아닙니다.
다음 변화를 살펴볼 수 있습니다.
- 선의 폭이 좁아지거나 넓어지는 위치
- 선 사이의 간격 변화
- 선 끝이 짧아져 보이는 부분
- 모서리가 둥글어지는 부분
- 조건에 따라 경계선이 크게 움직이는 위치
윤곽이 크게 움직이는 곳은 추가로 살펴볼 후보입니다. 움직임이 작다는 이유만으로 제조에 안전하다고 판정하지는 않습니다. 상대 도즈와 threshold의 관계, 보정 방법 및 검증 결과는 v0.10 릴리즈 노트에 자세히 정리했습니다.
7. Hotspot-like Shape Review
마지막 단계는 hotspot-like shape review입니다.
이 단계는 geometry-based candidate selection과 contour-based optical-response review를 결합합니다.
주요 신호는 다음과 같습니다.
- geometry screening으로 확인한 narrow width 또는 narrow space
- mask와 contour 사이의 visible mismatch
- 빛의 양에 따른 큰 contour movement
- narrow gap 주변 bridge-like response
- narrow line 주변 necking 또는 pinch-like response
- line-end-pullback-like response
- corner-rounding-like response
결과는 final pass/fail이 아니라 추가 검토할 위치를 빠르게 찾기 위한 visual guide입니다.
Geometry candidate
    + Aerial image behavior
    + Threshold contour behavior
    -> Lithography-aware review point
8. Current Scope and Limitations
GeoSignal Preview는 현재 public preview를 위한 정성적 시각화 workflow입니다.
다음과 같은 가정과 한계가 있습니다.
- public preview repository에는 core implementation code가 포함되어 있지 않습니다.
- candidate-selection logic은 optimized hotspot-ranking method가 아닙니다.
- mask는 binary mask로 취급하며 PSM-aware mask modeling은 포함하지 않습니다.
- imaging model은 simplified Abbe-based model입니다.
- Wafer-data-based calibration은 포함하지 않습니다.
- Resist 및 etch model은 포함하지 않습니다.
- threshold contour는 qualitative visual indicator입니다.
- 결과는 production CD prediction에 사용하면 안 됩니다.
- Optical parameter는 preview와 학습 목적으로 단순화했습니다.
- Public 또는 synthetic layout example을 사용합니다.
- optical analysis는 주로 ROI level에서 수행됩니다.
따라서 현재 method는 다음과 같이 이해해야 합니다.
layout-to-optical-response visualization
다음과 같은 의미는 아닙니다.
production lithography verification
9. Demo 페이지와의 관계
Demo 페이지는 이 method로 생성한 visual output을 보여줍니다.
| Demo Output | Method Step |
|---|---|
| Geometry-based candidate | Candidate ROI Selection |
| Rasterized mask | ROI Rasterization |
| Aerial image | Abbe-based Aerial Image Calculation |
| Relative-dose contour | Relative-dose Contour Extraction |
| Hotspot-like annotation | Hotspot-like Shape Review |
권장 읽기 순서는 다음과 같습니다.
- Demo 페이지에서 visual flow를 확인합니다.
- Method 페이지에서 계산 흐름을 이해합니다.
- 추가 optical background가 필요하면 Technical Notes를 확인합니다.
- 구현 이력이 필요하면 Release Notes를 확인합니다.