Demo
GDS를 올리고, 좁은 곳을 찾고, 관심 있는 패턴을 크게 살펴봅니다.
공개 예제로 직접 살펴보세요
Live Demo에서 후보 위치를 찾고 주변 형상을 살펴보세요.
Live Demo 열기공개 가능한 파일만 사용해 주세요. 무료 서버의 시작과 분석에는 시간이 걸릴 수 있습니다.
전체 후보 위치와 주요 패턴이 먼저입니다. 선택한 레이어에서 폭·간격이 좁은 곳을 찾고, 일부 후보에 대해 빛의 분포와 윤곽을 계산합니다. Focus/Dose 비교는 더 자세히 보고 싶을 때 사용하는 옵션입니다.
1. 화면 사용 가이드
전체 지도 다음에 유형별 기본 6개 후보를 보여줍니다. 4·6·8개 중 선택하고 Width/Space를 전환할 수 있습니다. 카드를 누르면 아래에 결과 영역 너비를 채우는 큰 이미지가 나타납니다. 표시 개수는 상세 검토 개수이며 전체 기하학 검사 범위를 제한하지 않습니다.
아래는 저장된 데이터를 이용한 인터랙티브 초안입니다. 유형별 6개 예시가 있으며 실제 PW 데이터는 Width·Space 각각 1번 후보에 연결했습니다. 나머지는 미계산으로 표시하고, 8개를 선택해도 없는 예시를 만들어 표시하지 않습니다. 현재 배포 앱과는 화면이 다를 수 있습니다.
| 번호 | 항목 | 사용 방법 |
|---|---|---|
| ① | File | 공개 가능한 GDS/OAS를 선택합니다. |
| ② | Layer / Datatype | 분석할 레이어를 지정합니다. TT04 PWM의 68/20도 대상이 될 수 있습니다. |
| ③ | Width / Space limit | 기하학적 후보를 찾는 기준입니다. 인쇄 CD 허용 오차가 아닙니다. |
| ④ | ROI / Pixel size | 검토 범위와 픽셀 간격입니다. 조명은 dense7로 고정됩니다. |
| ⑤ | Focus / Dose | ±범위를 지정합니다. 각 축 3점, 총 9개 조합의 모양과 CD 변화를 비교합니다. |
| ⑥ | Override reference | 보통 비워 둡니다. 다른 설계 기준에 맞추려면 중심 X/Y, 설계 폭, 측정 방향을 입력합니다. |
| ⑦ | Candidate locations | 전체 GDS에서 후보 분포를 확인합니다. |
| ⑧ | Main candidates | 기본 6개, 4·6·8개 선택. 카드를 누르면 아래에 크게 표시됩니다. |
| ⑨ | Optional comparison | 선택 후보의 3×3 이미지와 Bossung 그래프를 펼칩니다. 합격/불합격 판정은 하지 않습니다. |
현재 배포 앱 사용 시
위 화면은 변경 예정 흐름의 미리보기입니다. 현재 배포 앱에서는 등록 예제 외 파일에 기준 위치·측정 방향·설계 폭 입력이 필요할 수 있습니다. 실제 앱에 표시되는 기준 입력 안내를 따라 주세요.
Override reference는 보통 비워 둡니다. 아래 예시는 TT04 PWM 67/20의 (147.770, 108.460) µm anchor를 설계 폭 170 nm에 맞춘 기준을 공유합니다. 실제 웨이퍼 측정값에 맞춘 보정은 아니며, 각 후보의 폭을 개별적으로 다시 맞추지 않습니다.
2. 주요 후보 찾기
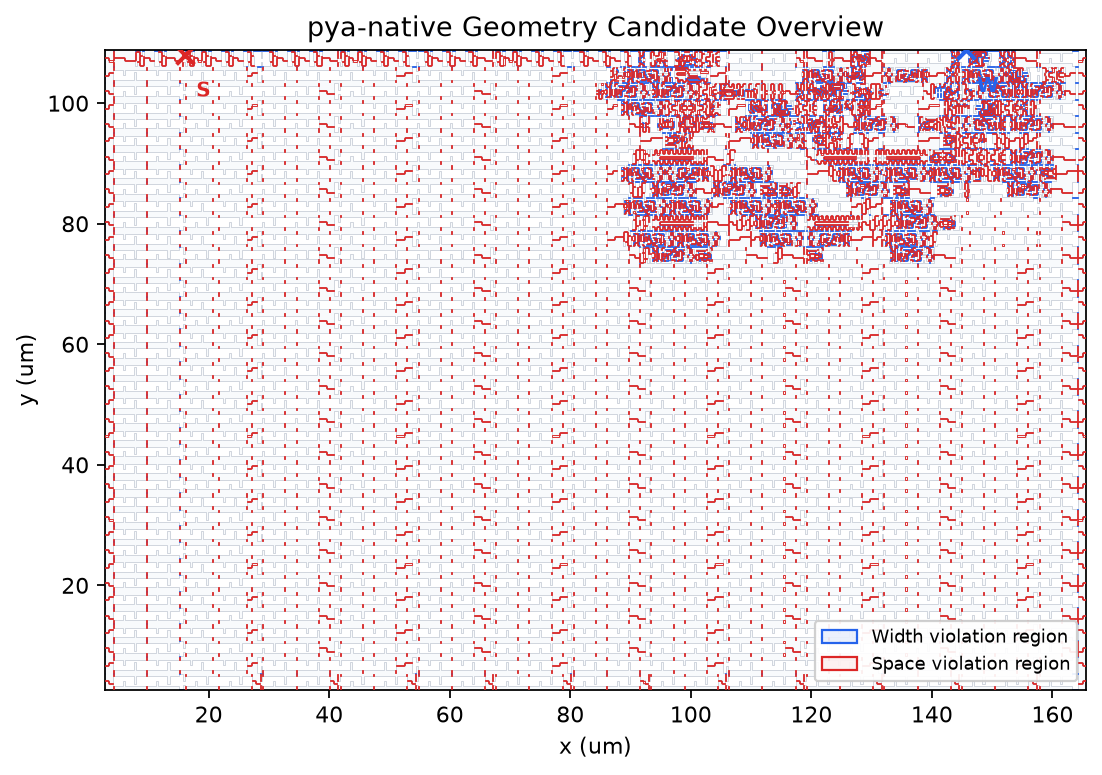
TT04 PWM 67/20 전체에서 후보가 어디에 있는지 먼저 확인합니다. 표시는 검토할 위치이며 실제 제조 불량 판정이 아닙니다.
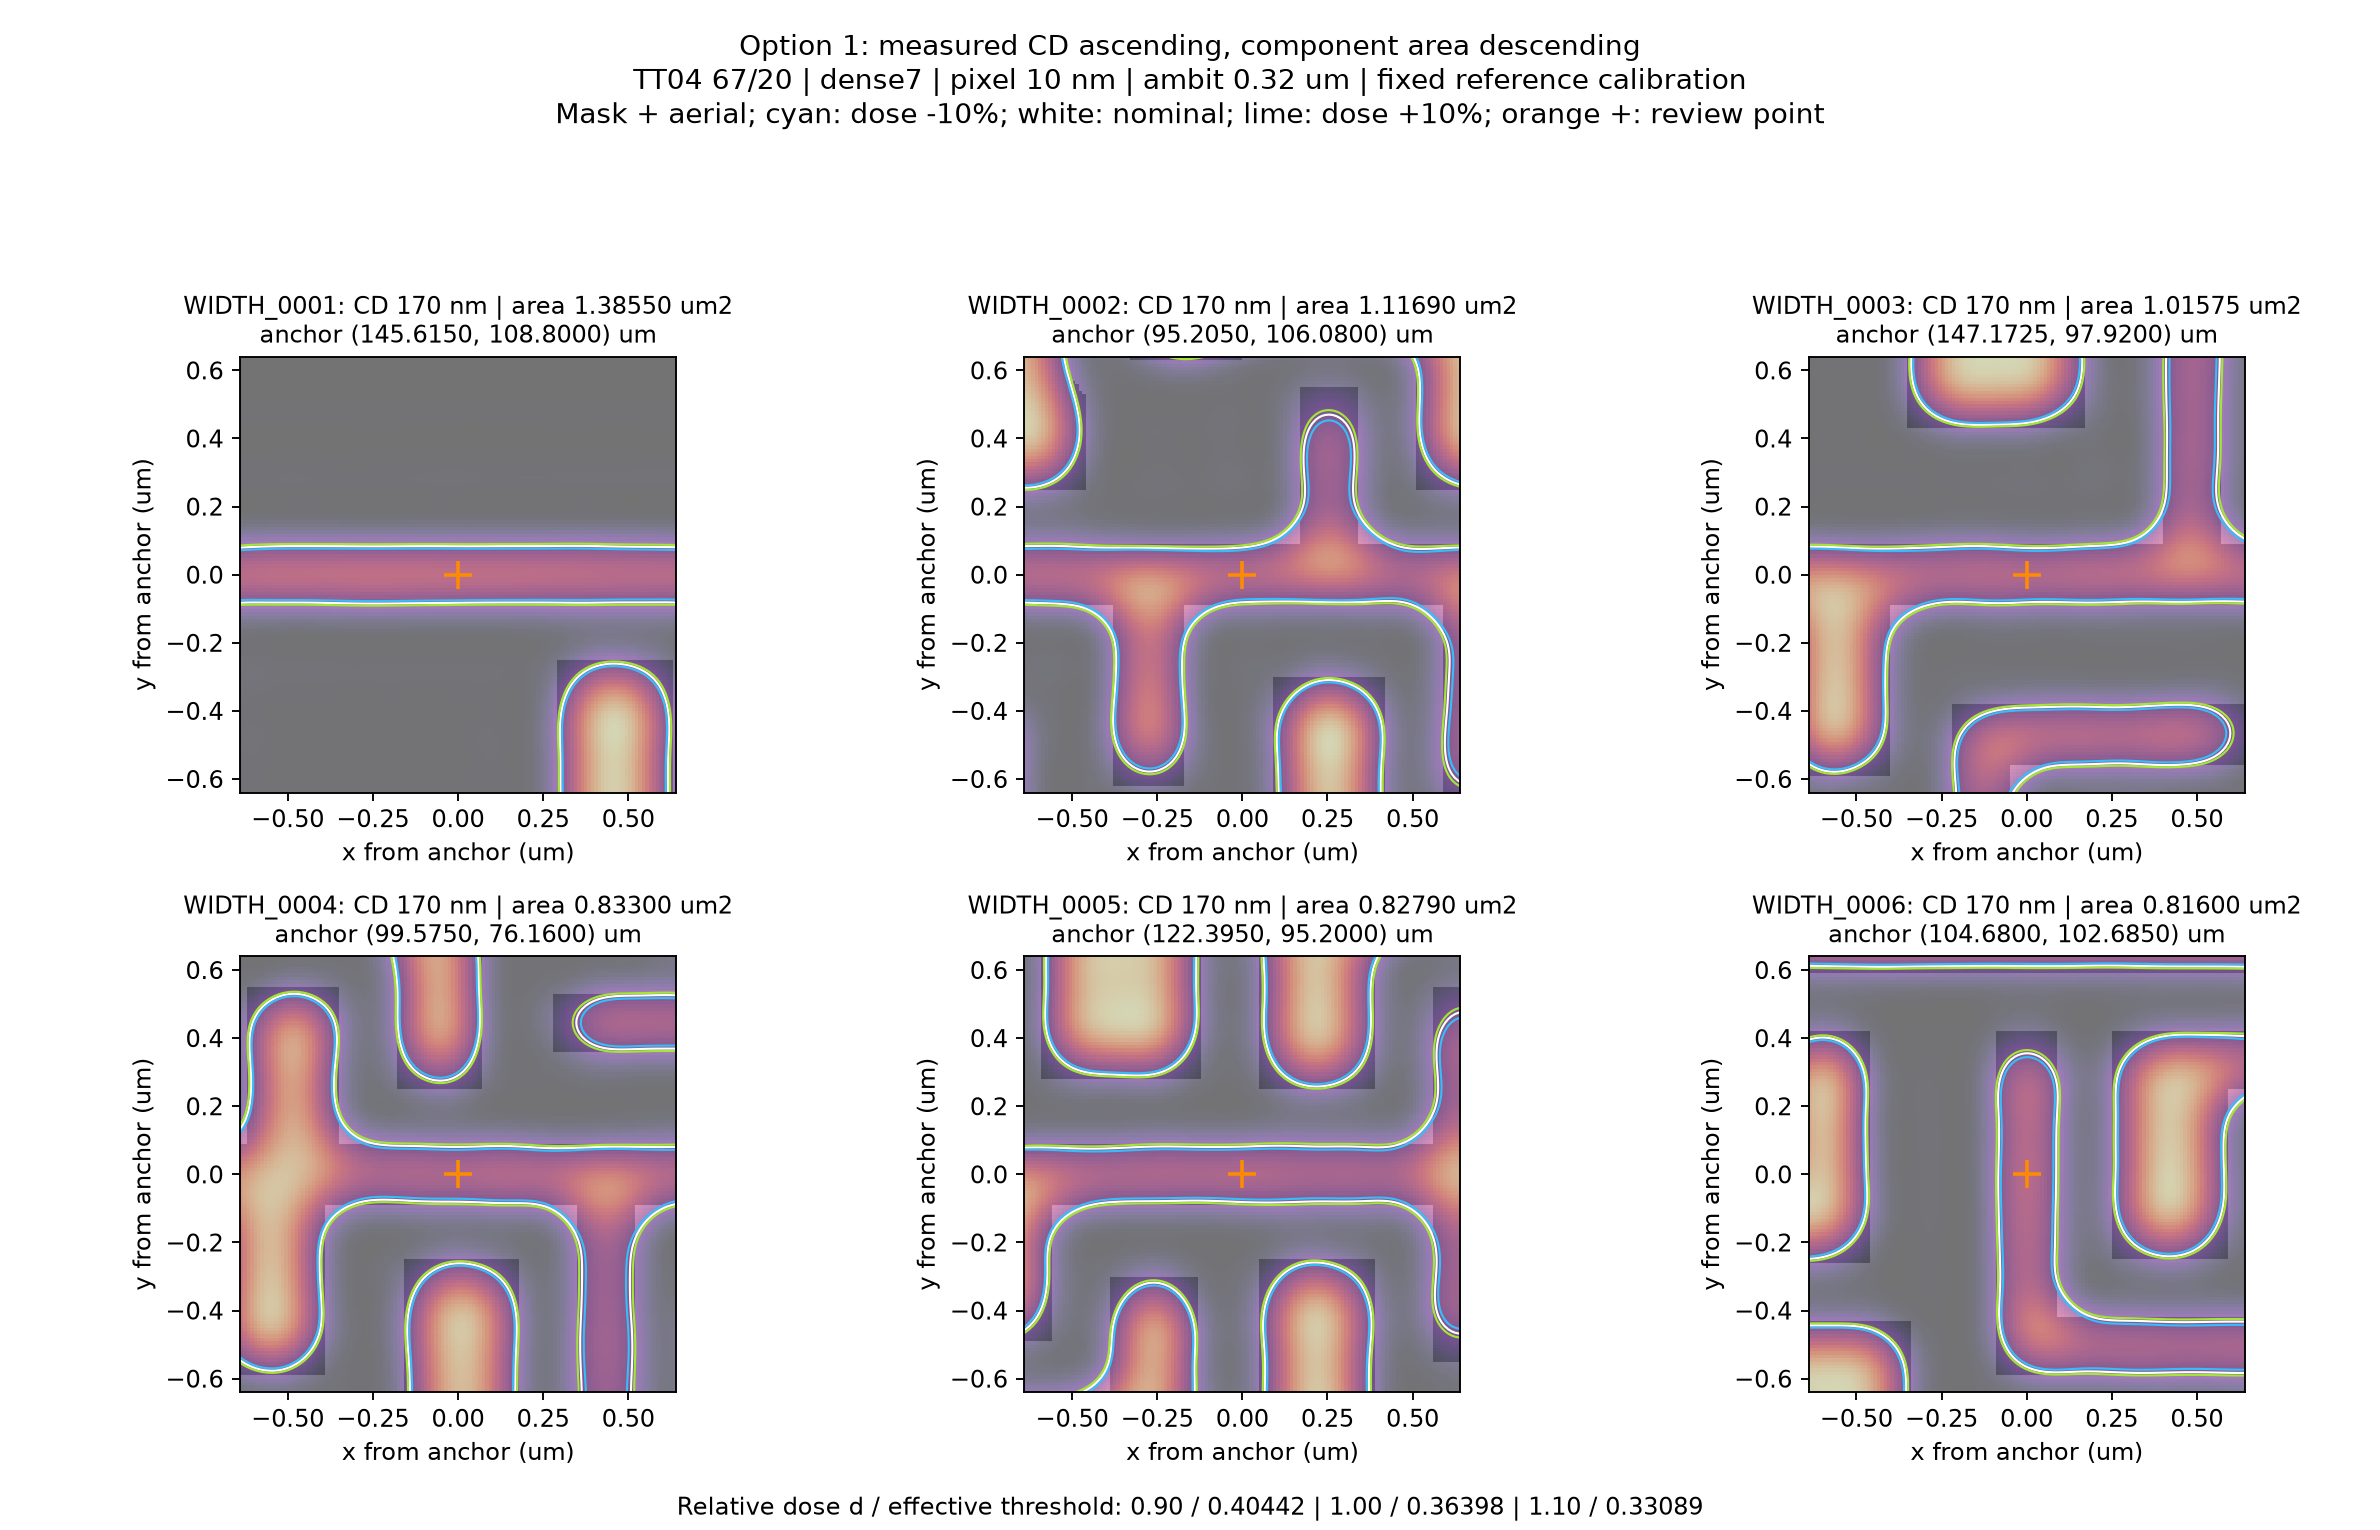
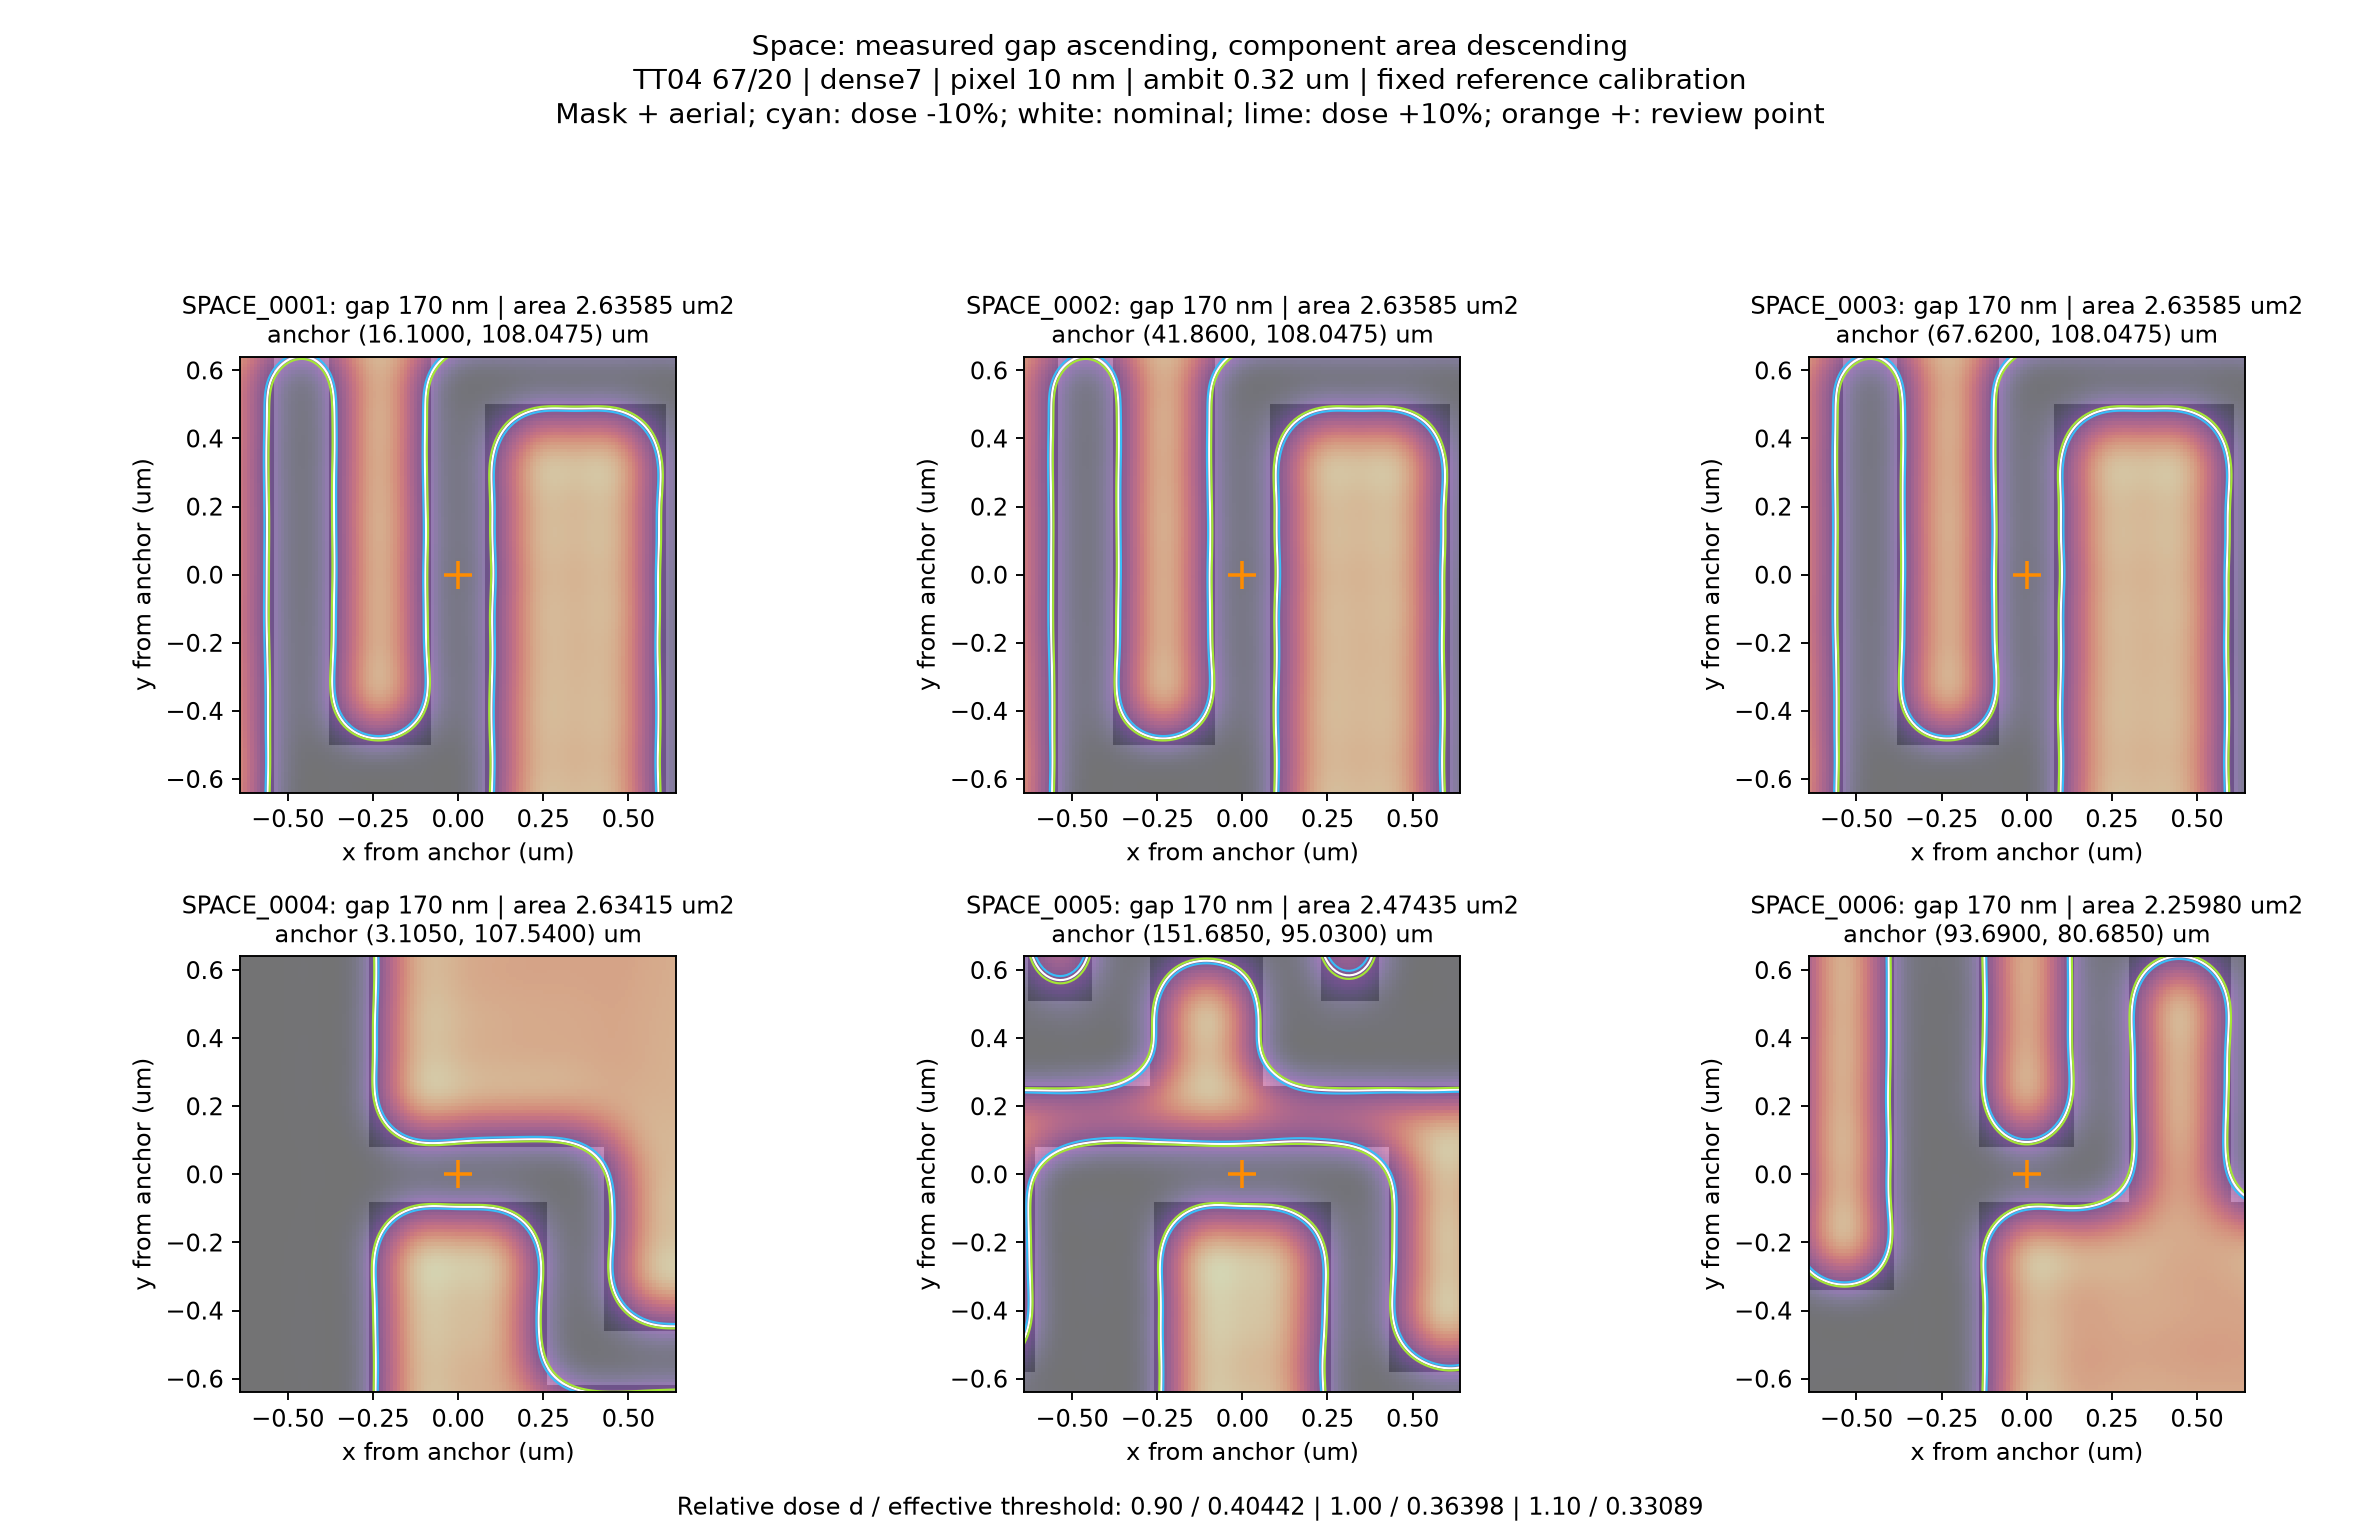
원래 도형의 폭·간격이 좁은 순서로, 같으면 후보 면적이 큰 순서로 검토합니다. 아래는 Width·Space 각 6개입니다. 붉은 계열은 빛의 분포, 하늘색·흰색·연두색 윤곽은 도즈 −10%·기준·+10%입니다.
이미지 범위: 후보 확대 이미지(nominal·3×3 포함)는 계산 ROI 2.56 × 2.56 µm 안의 중심 1.28 × 1.28 µm만 보여줍니다. 계산에는 각 변 바깥 0.32 µm의 광학 여유 영역도 포함됩니다. 확대는 표시 범위만 바꾸며 계산 조건은 바꾸지 않습니다. 전체 지도는 레이어 전체를 보여줍니다.
Width · top 6
Space · top 6
3. 실제 사례: 67/20과 68/20
공개 TT04 PWM GDS를 로컬에서 실제 계산한 결과입니다. 두 레이어에 같은 67/20 기준을 적용하고 각 후보와 측정 위치를 고정했습니다. Render 실행 검증이나 레이어 간 성능 순위는 아닙니다.
먼저 nominal 패턴 두 개를 보고, 필요하면 아래 비교를 펼쳐 9개 조건과 Bossung 그래프를 확인하세요.
아래 사례도 같은 1.28 µm 확대 범위와 2.56 µm 계산 ROI를 사용합니다.
TT04 PWM 67/20
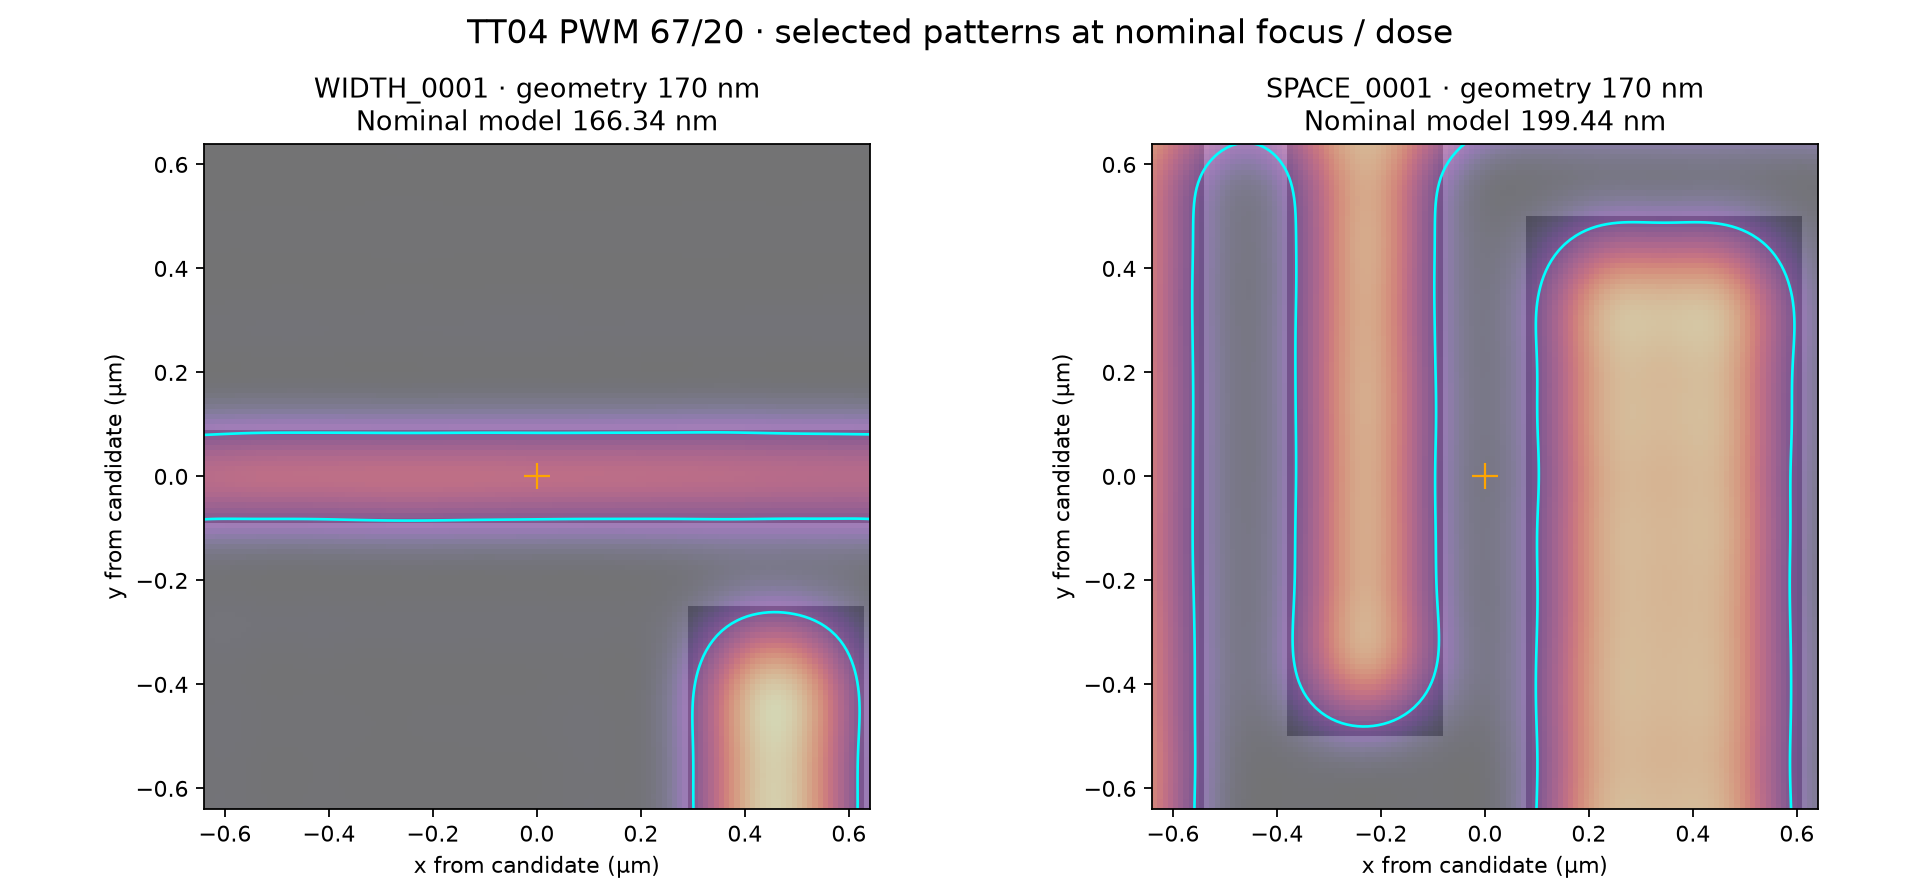
공통 기준을 사용하므로 원래 도형의 치수와 모델 결과가 다를 수 있습니다. 이 후보들에 따로 치수를 맞춘 것은 아닙니다.
선택 보기: Focus/Dose 이미지와 Bossung 그래프
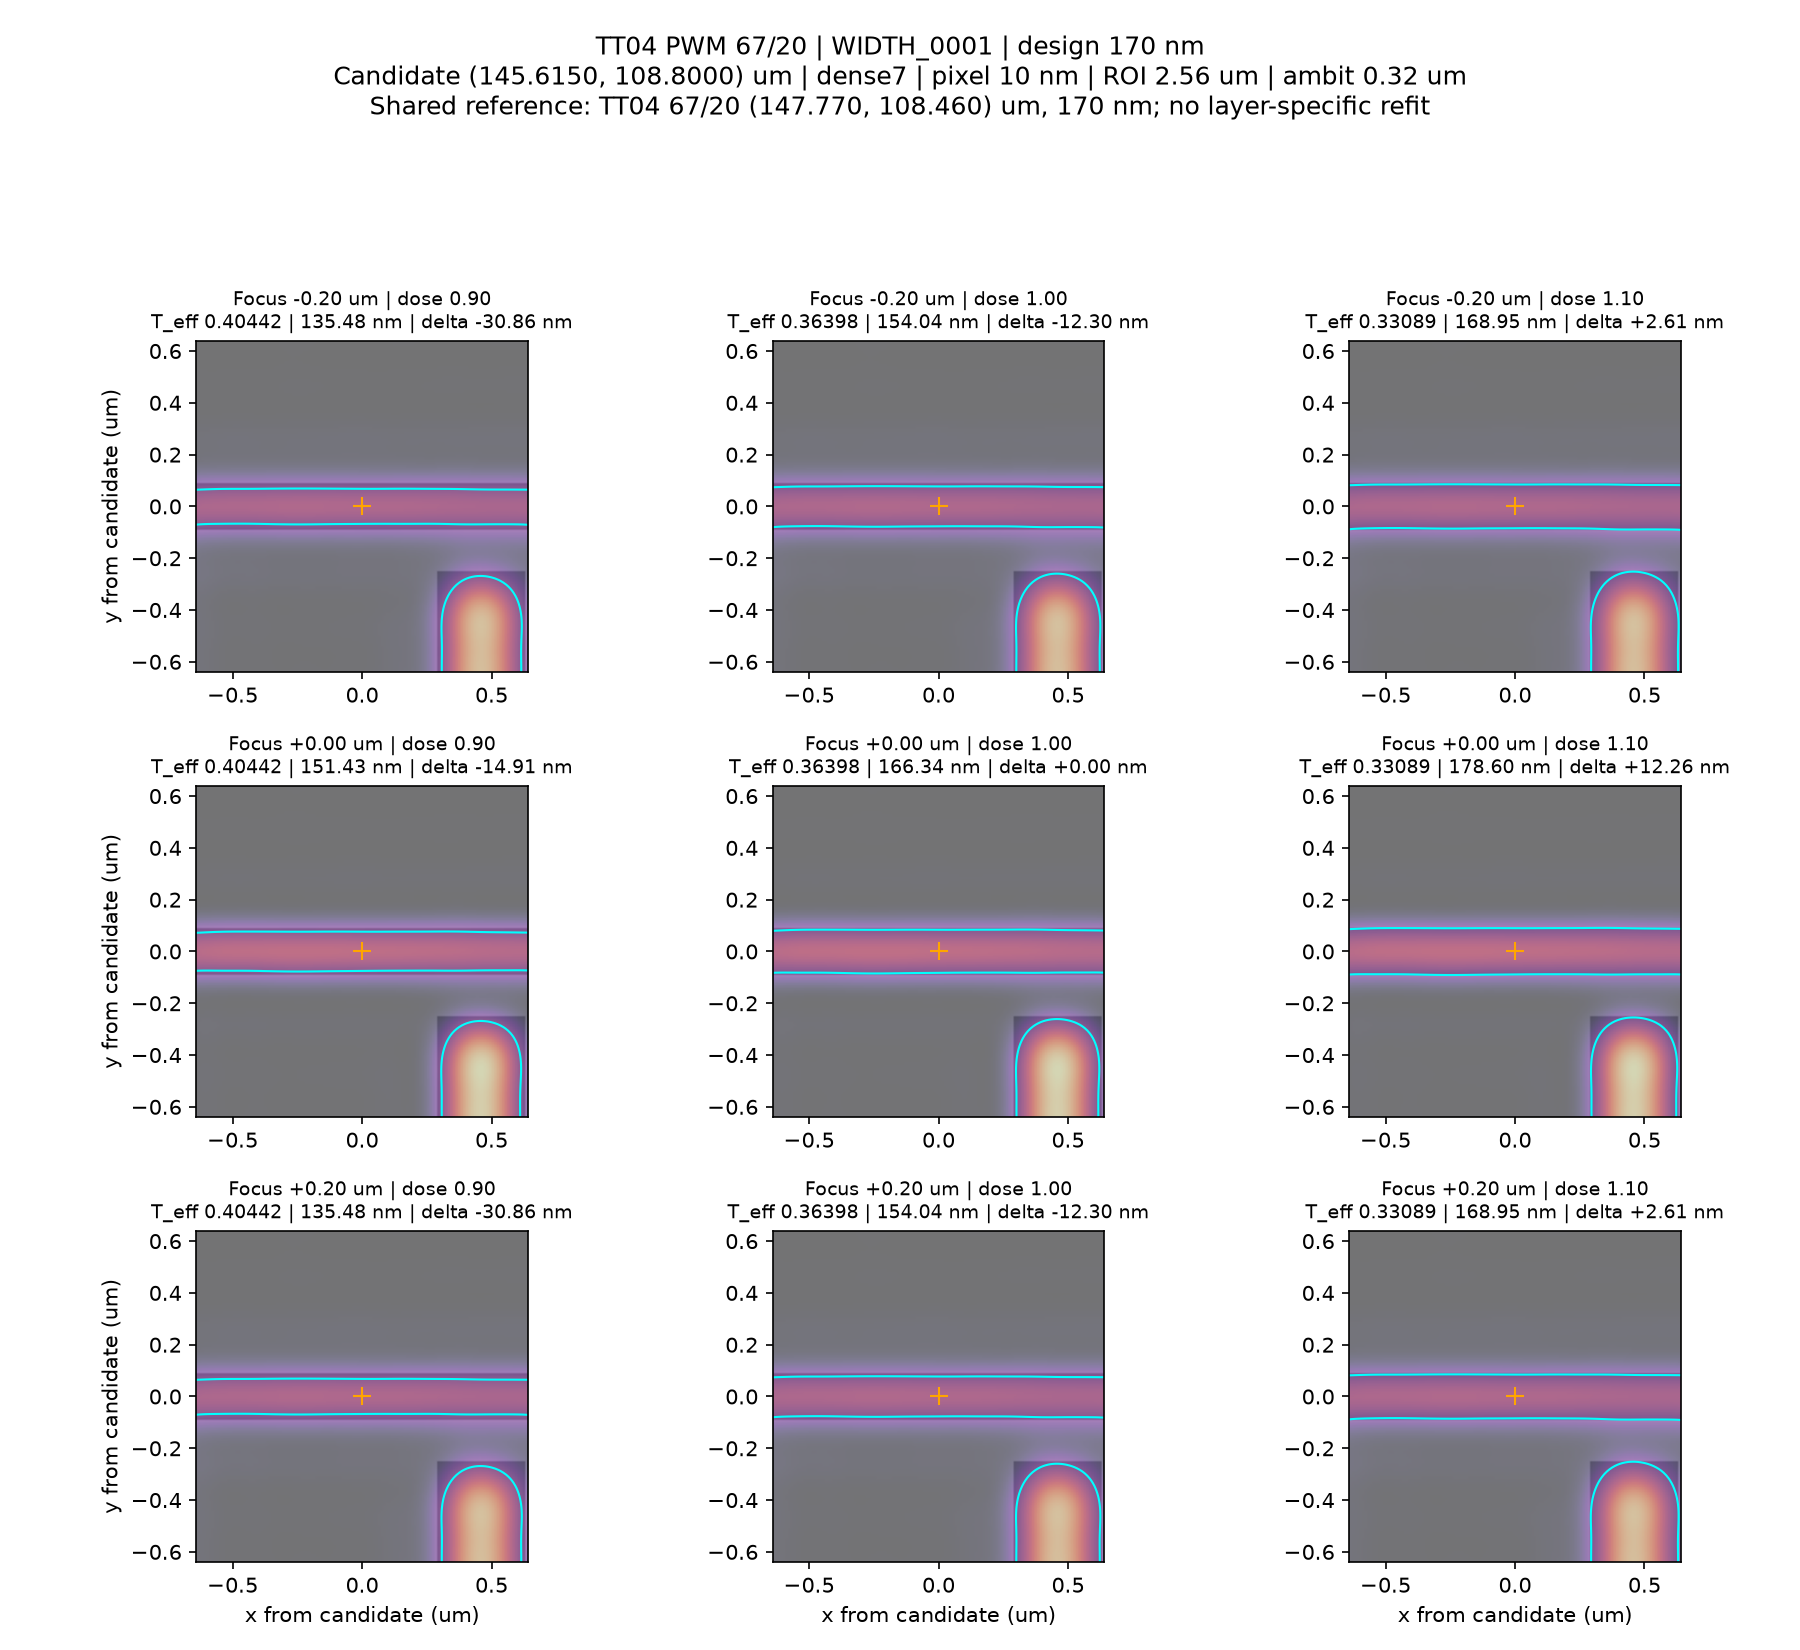
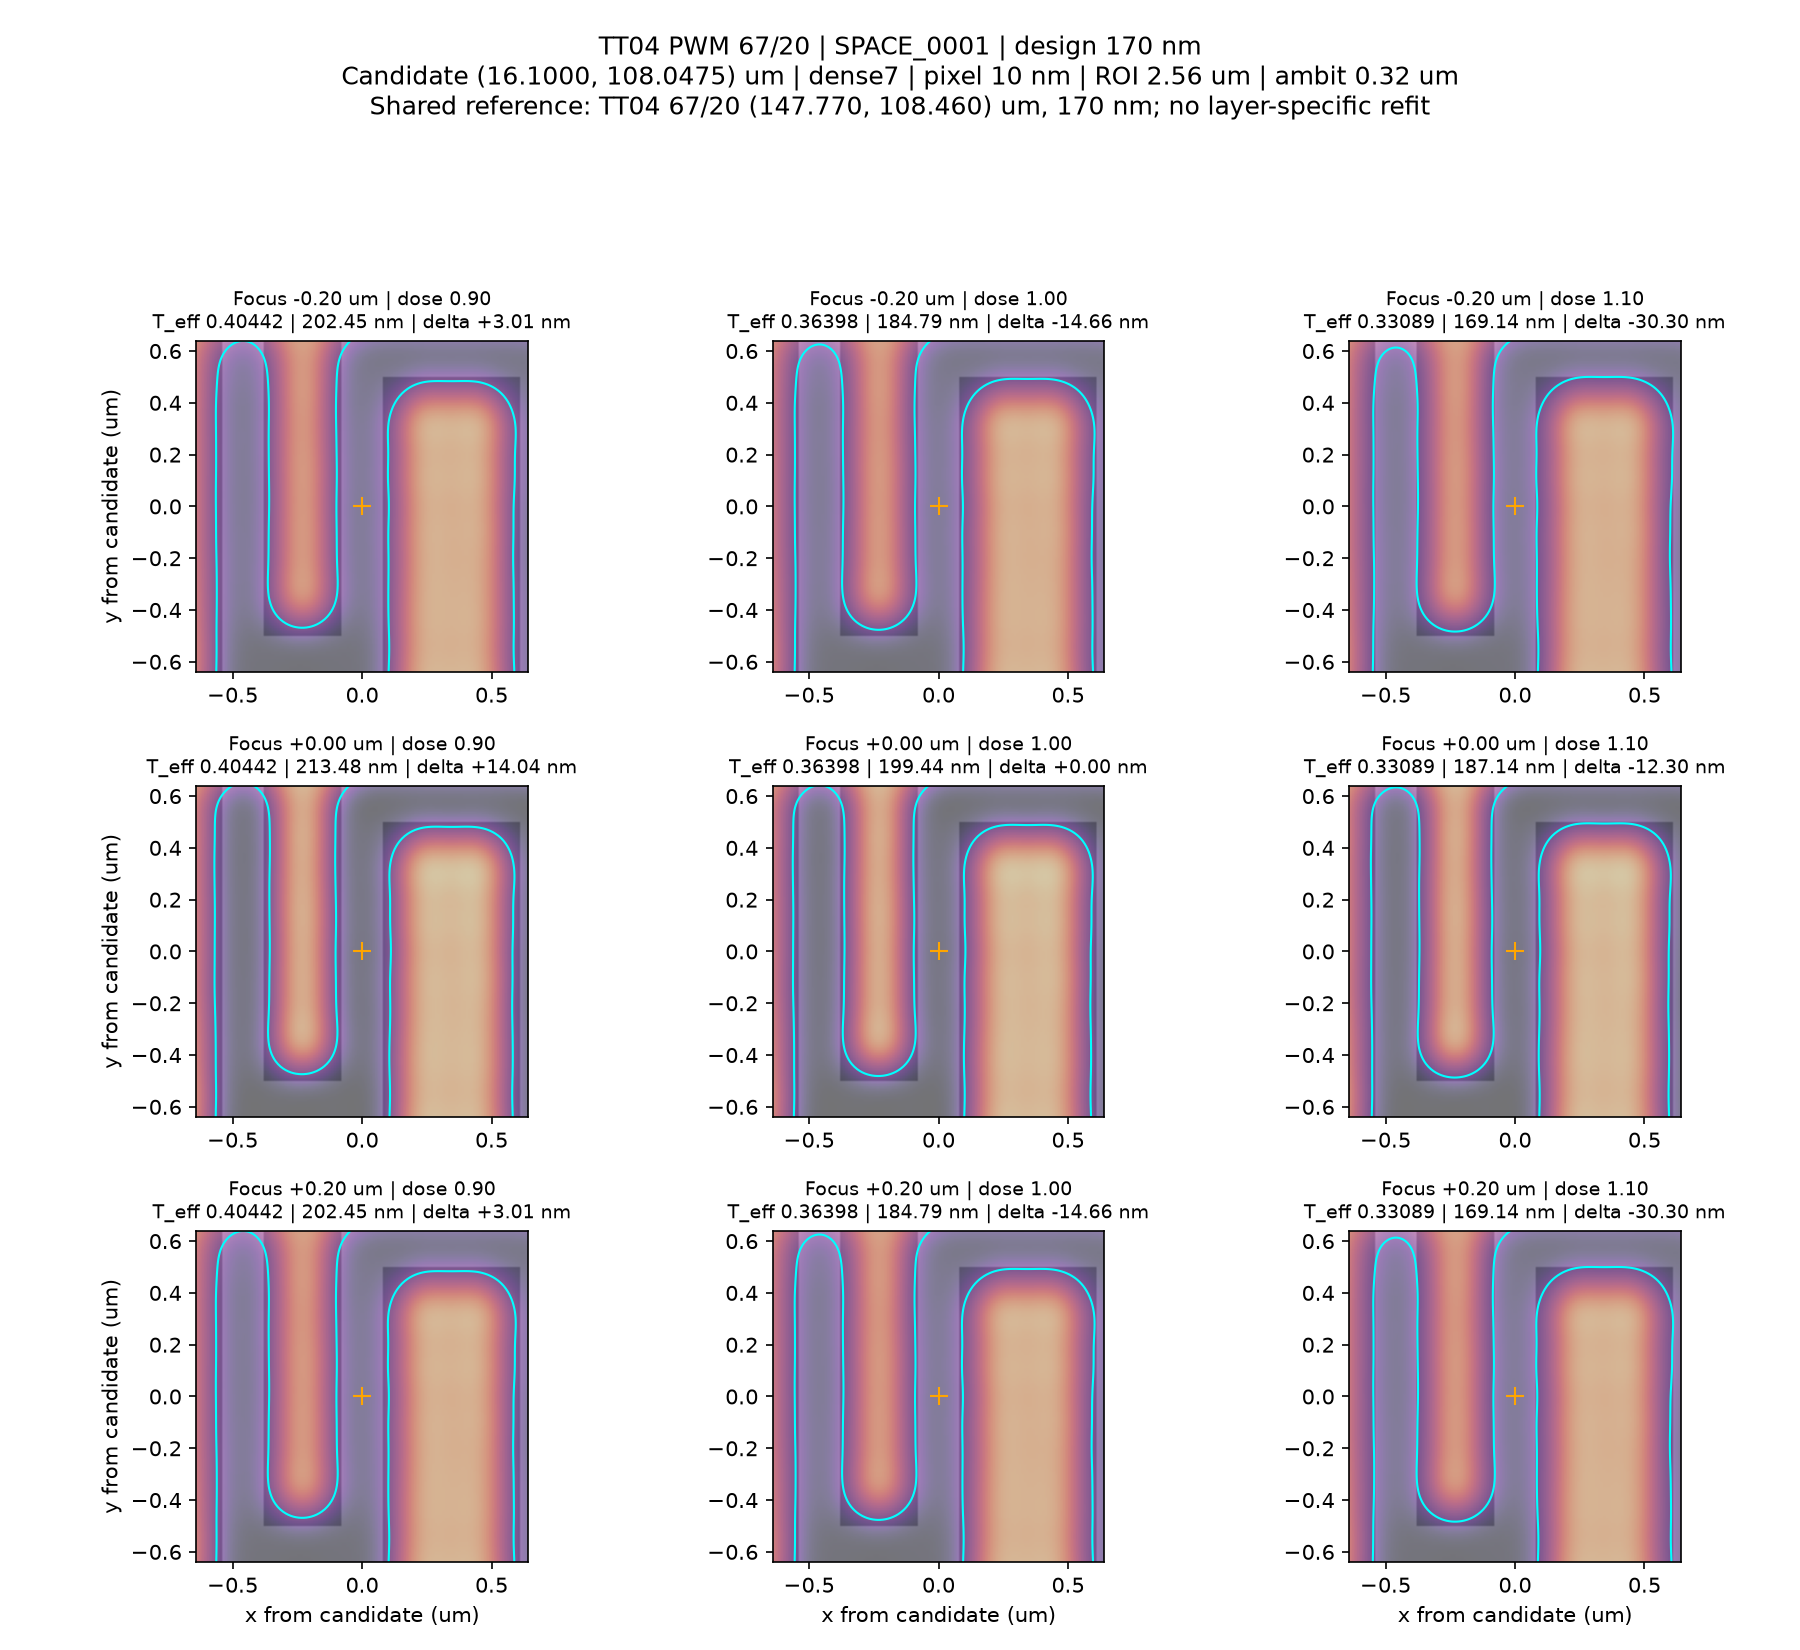
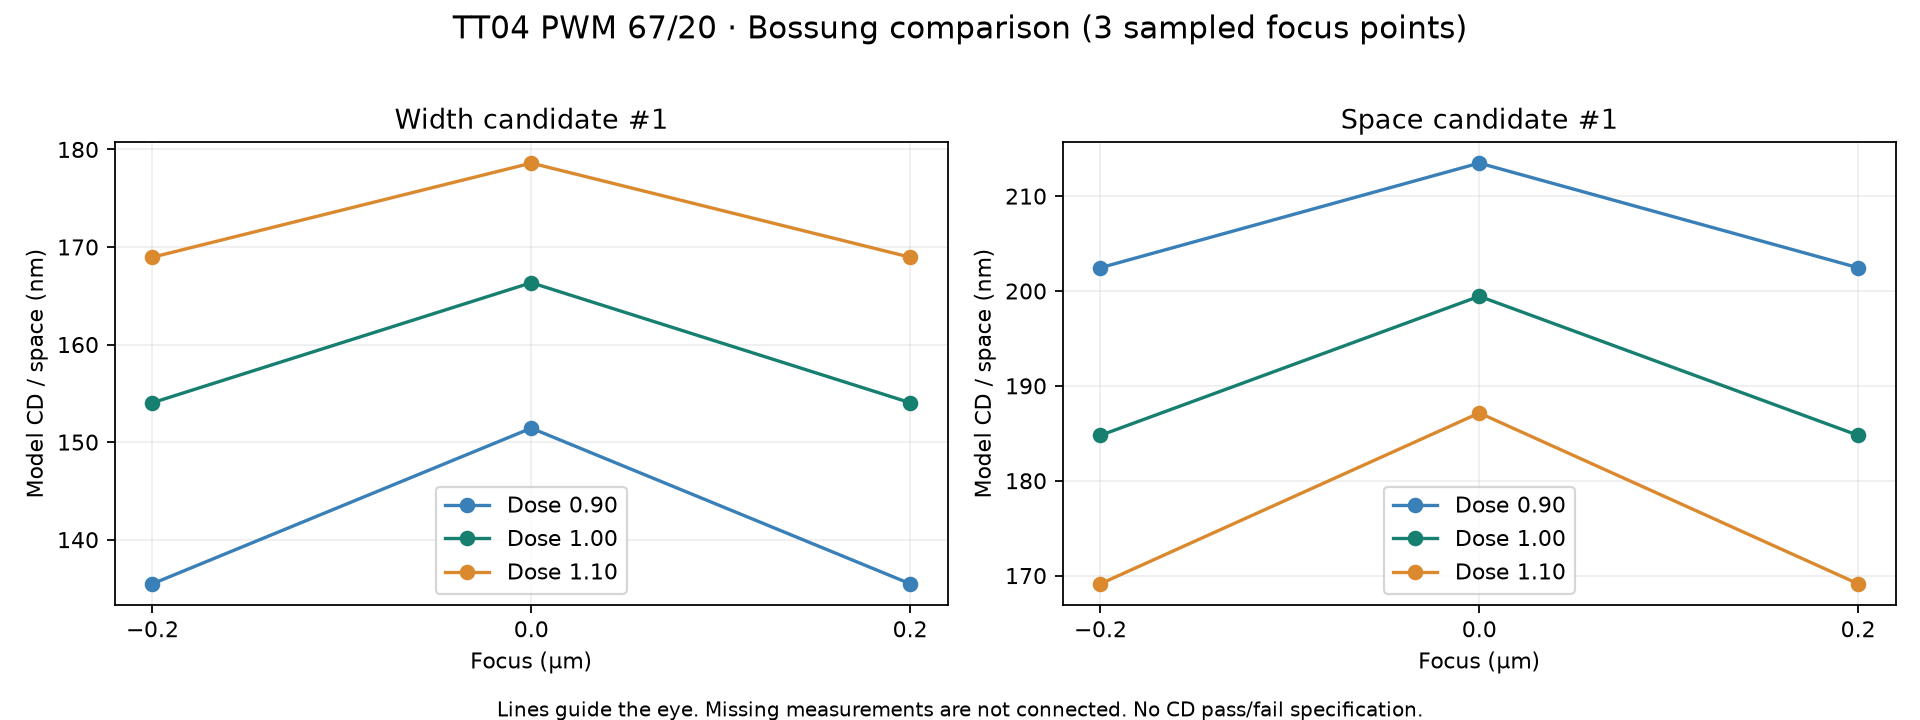
초점 −0.20 / 0 / +0.20 µm, 상대 도즈 0.90 / 1.00 / 1.10입니다. Bossung 그래프는 가로축 초점, 세로축 측정 치수이며 도즈별 선을 표시합니다. 측정 불가는 연결하지 않습니다. 초점 3점은 추세 확인용으로 정밀한 DoF 추정이나 CD 합격/불합격 판정을 하지 않습니다.
TT04 PWM 68/20
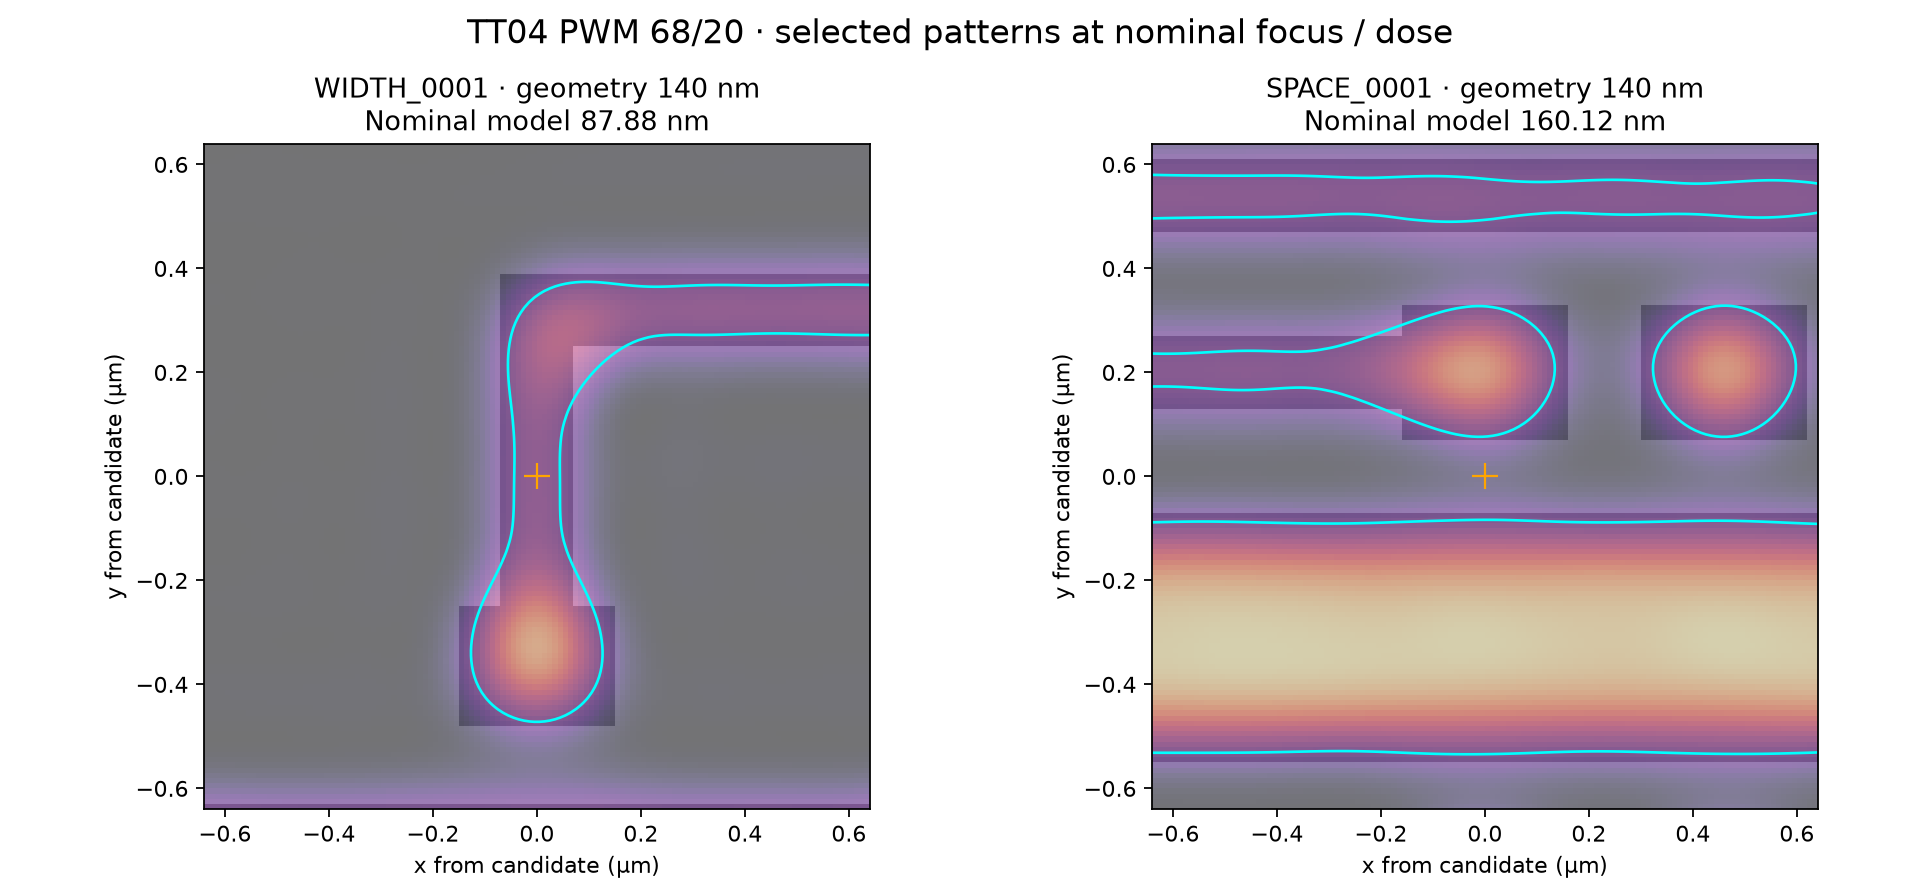
선택된 Width 후보는 목이 좁아지는 패턴입니다. 원래 폭은 140 nm이고 nominal 모델 측정값은 약 88 nm입니다. 도즈 0.90·초점 ±0.20 µm에서는 고정 측정선 기준으로 형상이 소실되어 측정 불가로 표시됩니다. 이는 해당 위치의 모델 반응이며 실제 웨이퍼 불량 판정은 아닙니다.
선택 보기: Focus/Dose 이미지와 Bossung 그래프
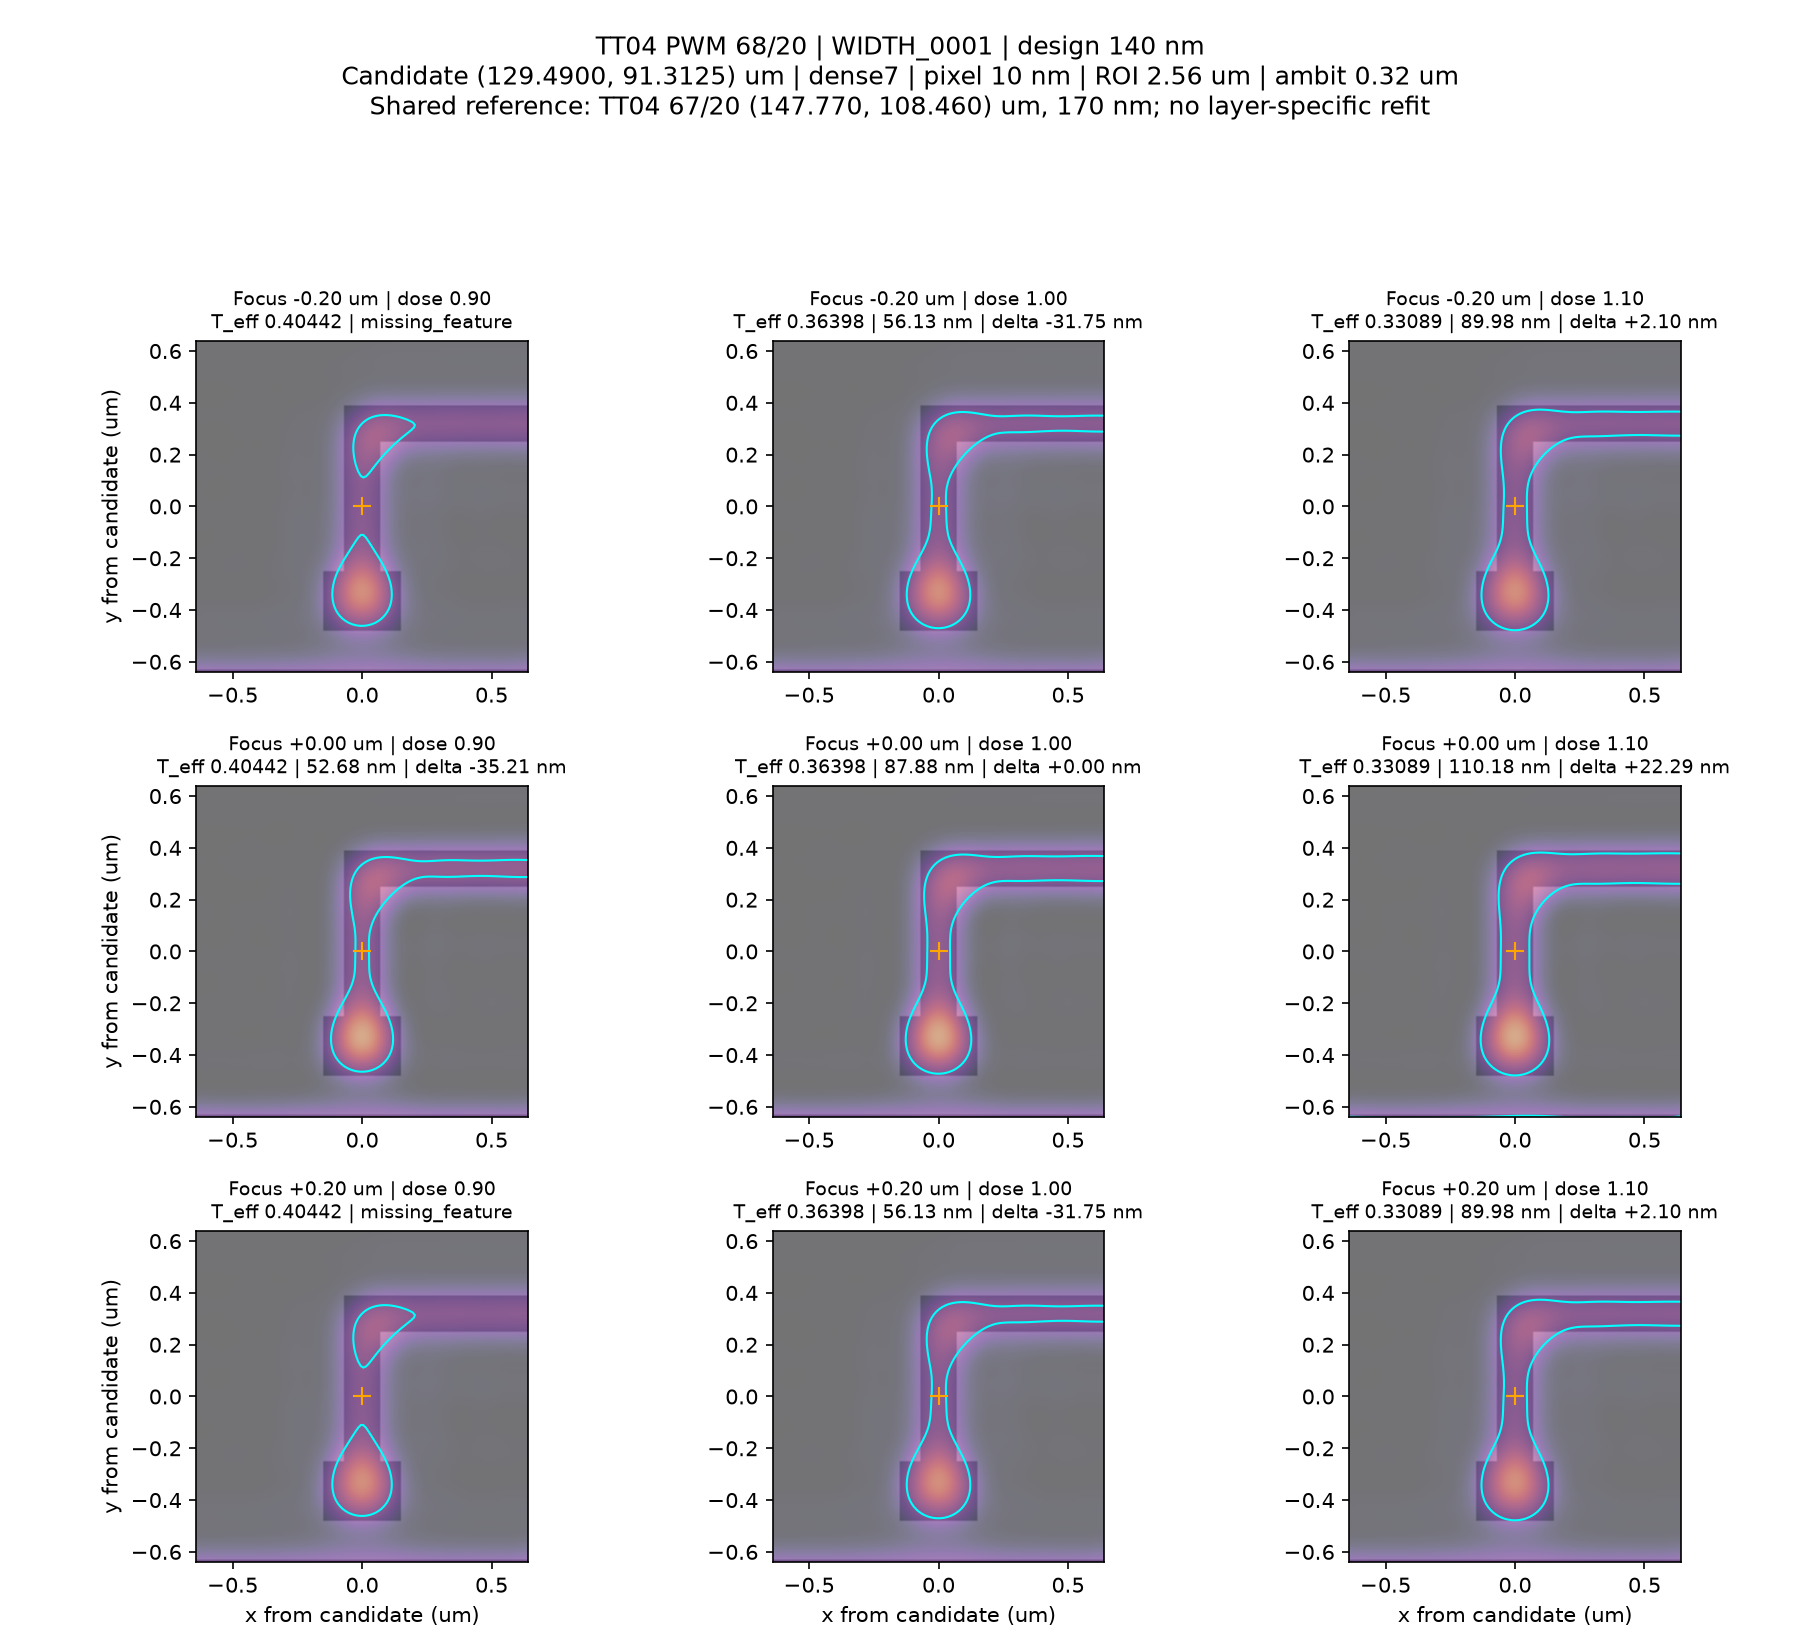
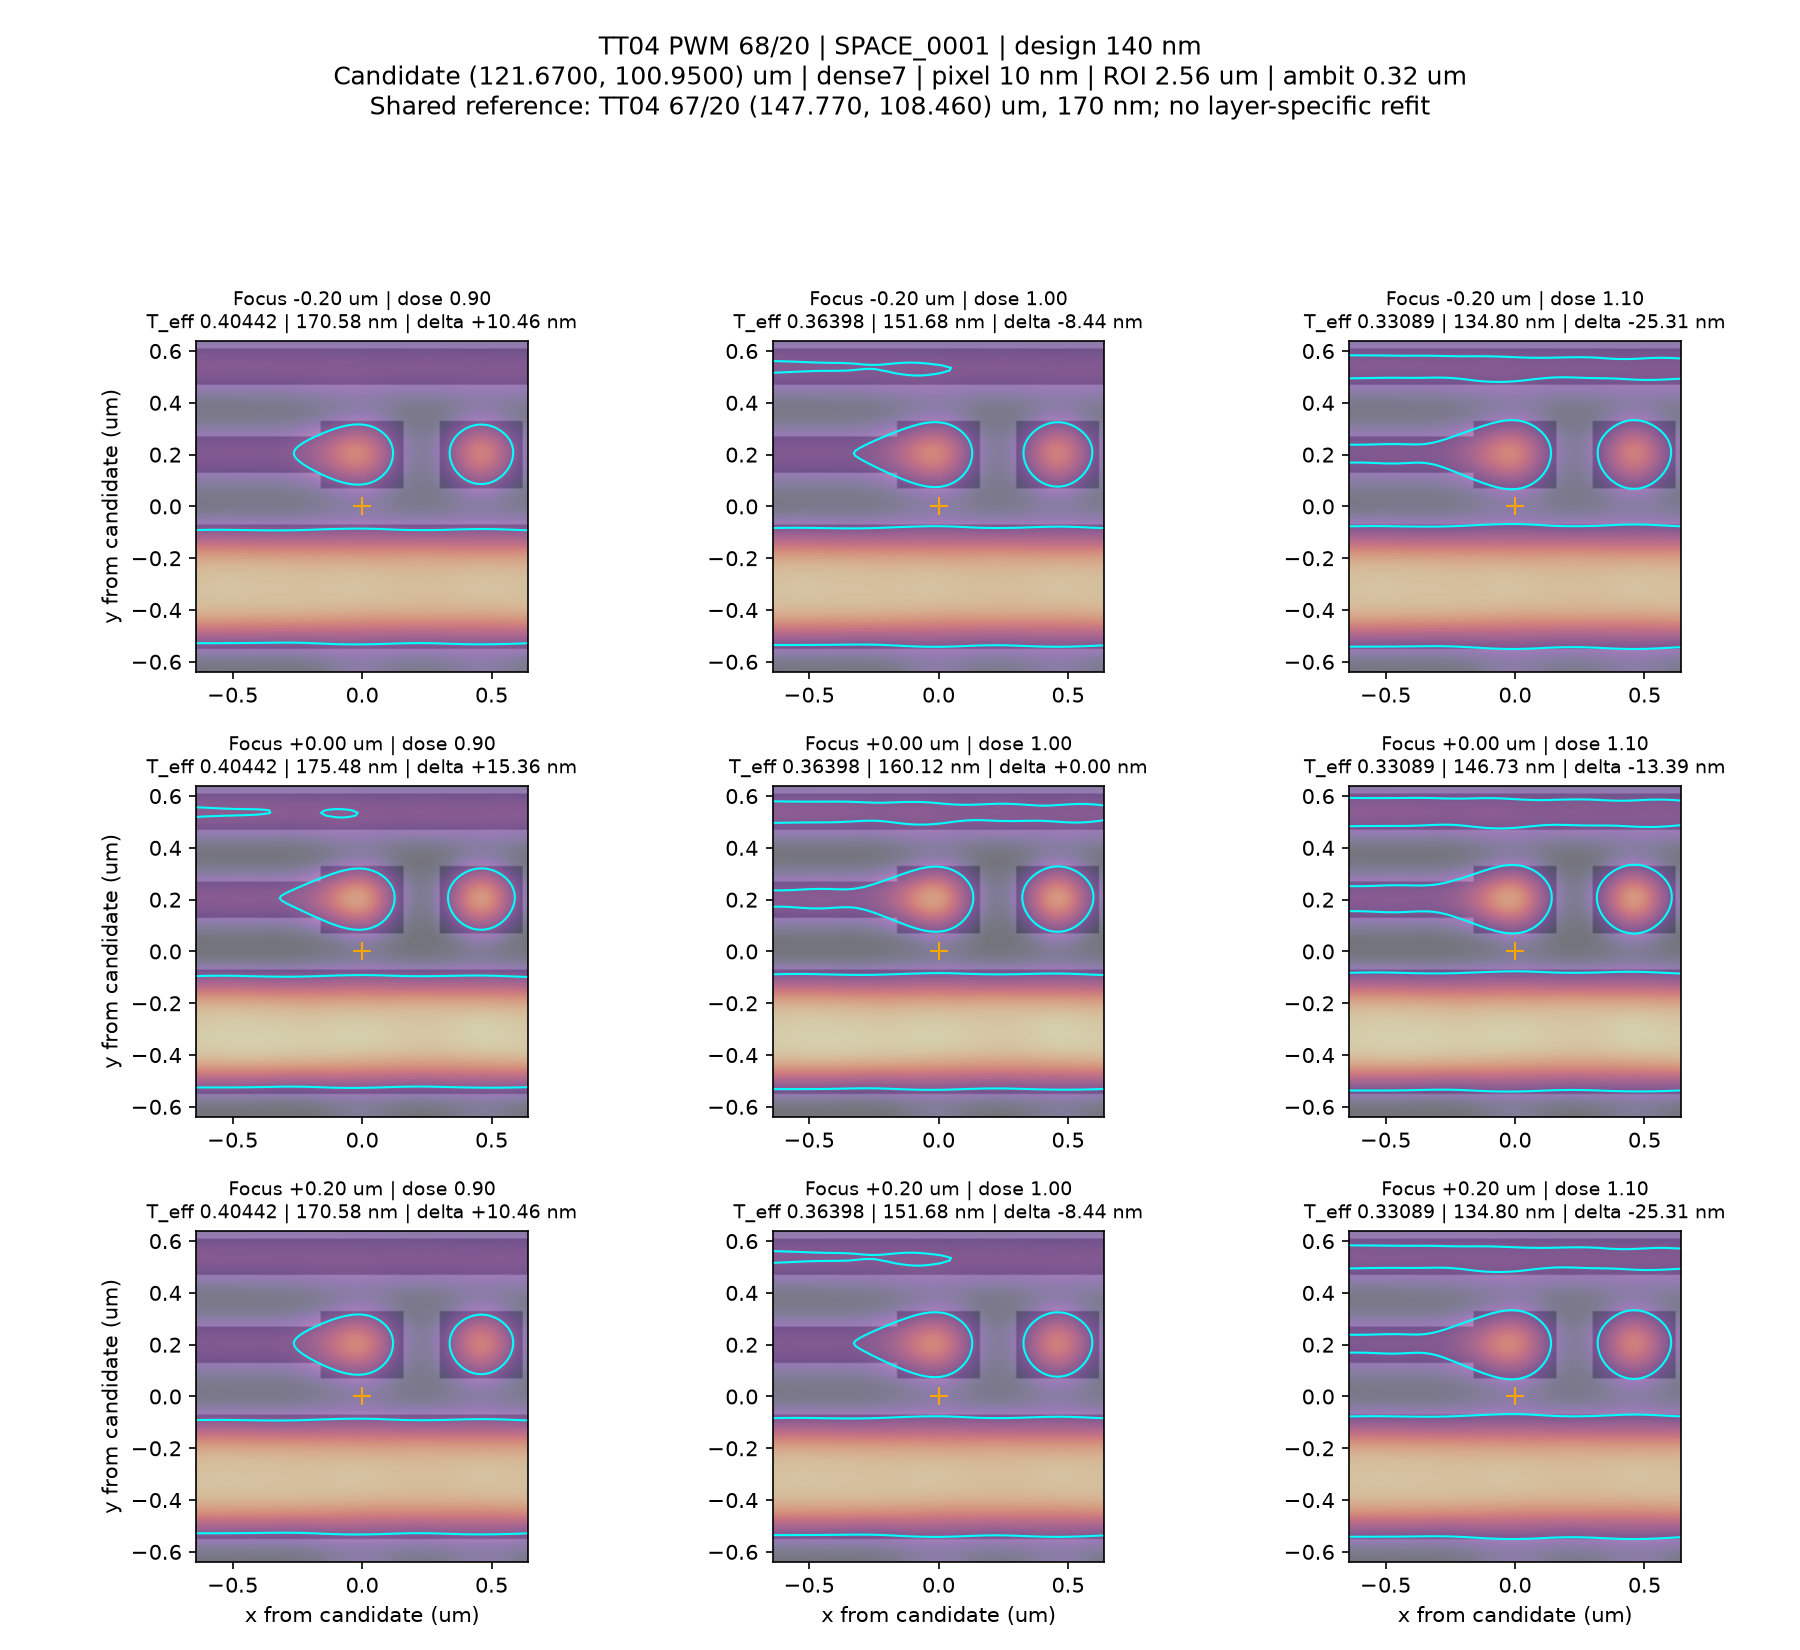
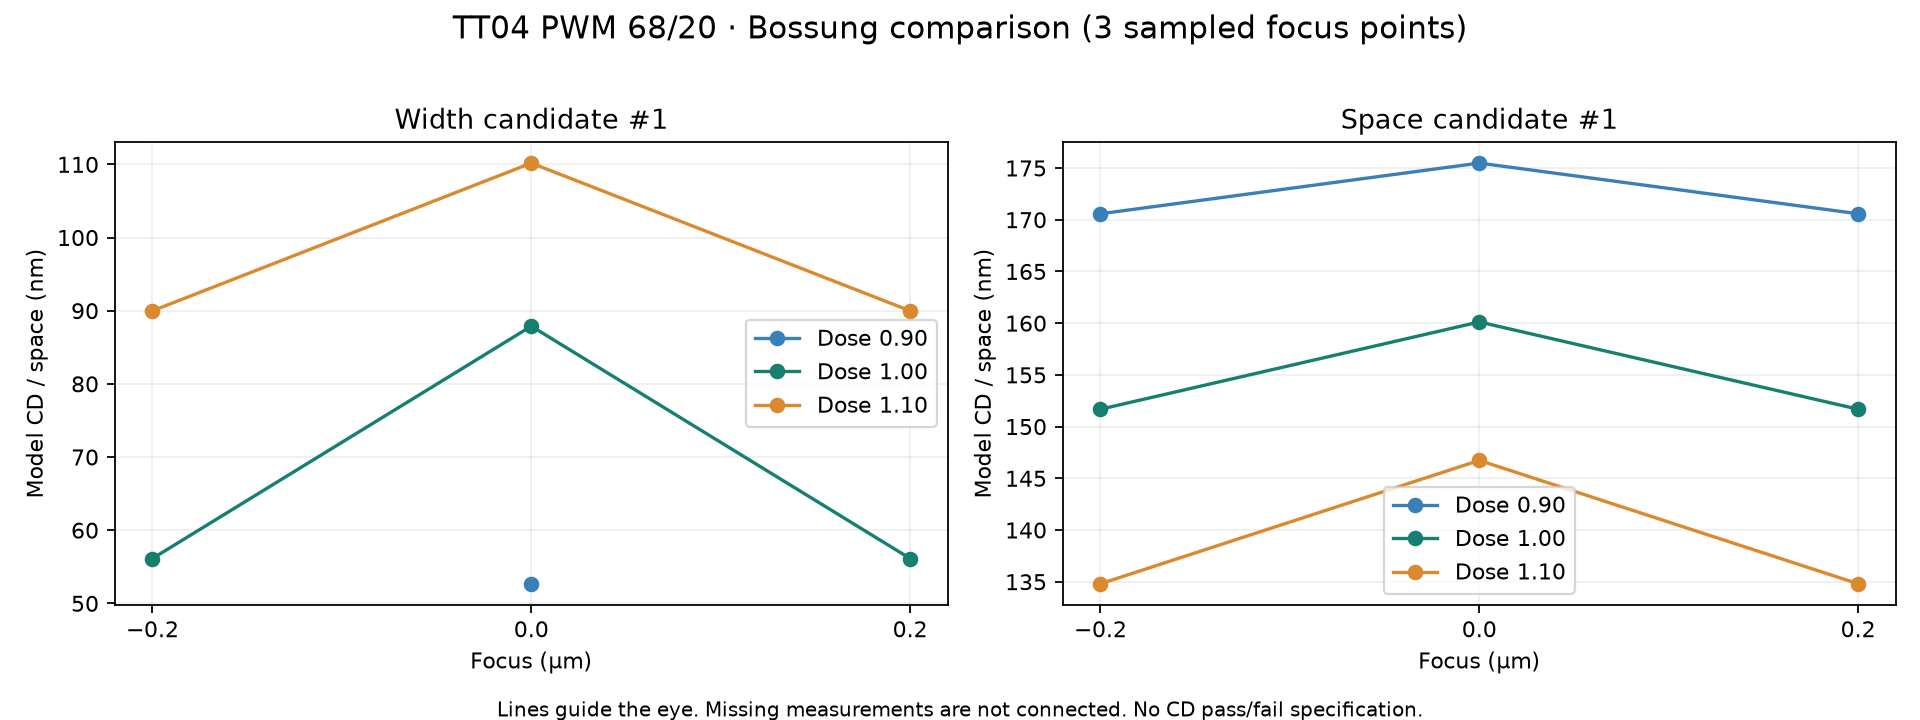
초점 −0.20 / 0 / +0.20 µm, 상대 도즈 0.90 / 1.00 / 1.10입니다. Bossung 그래프는 가로축 초점, 세로축 측정 치수이며 도즈별 선을 표시합니다. 측정 불가는 연결하지 않습니다. 초점 3점은 추세 확인용으로 정밀한 DoF 추정이나 CD 합격/불합격 판정을 하지 않습니다.
4. 결과 읽기
목이 좁아지는지, 간격이 닫히는지, 코너가 둥글어지거나 선 끝이 물러나는지 살펴보세요. 주황 십자는 측정 위치입니다. 3×3의 시안색 선은 계산한 윤곽, Δ는 해당 후보의 nominal 대비 변화입니다. 비교 이미지 안의 밝기 기준은 동일하게 유지했습니다.
모델에서는 폴리곤 영역에 빛이 들어간다고 가정합니다. 이 윤곽만으로 현상·식각 후 어떤 재료가 남는지 결정하지 않습니다. 학습용 상대 모델이며 실측 공정에 보정된 예측이 아닙니다.
5. Data and details
검토용 GDS는 저장된 67/20 예시이며 68/20 비교 결과는 포함하지 않습니다. 업로드에는 공개 가능한 비기밀 레이아웃만 사용하세요.