GeoSignal Preview
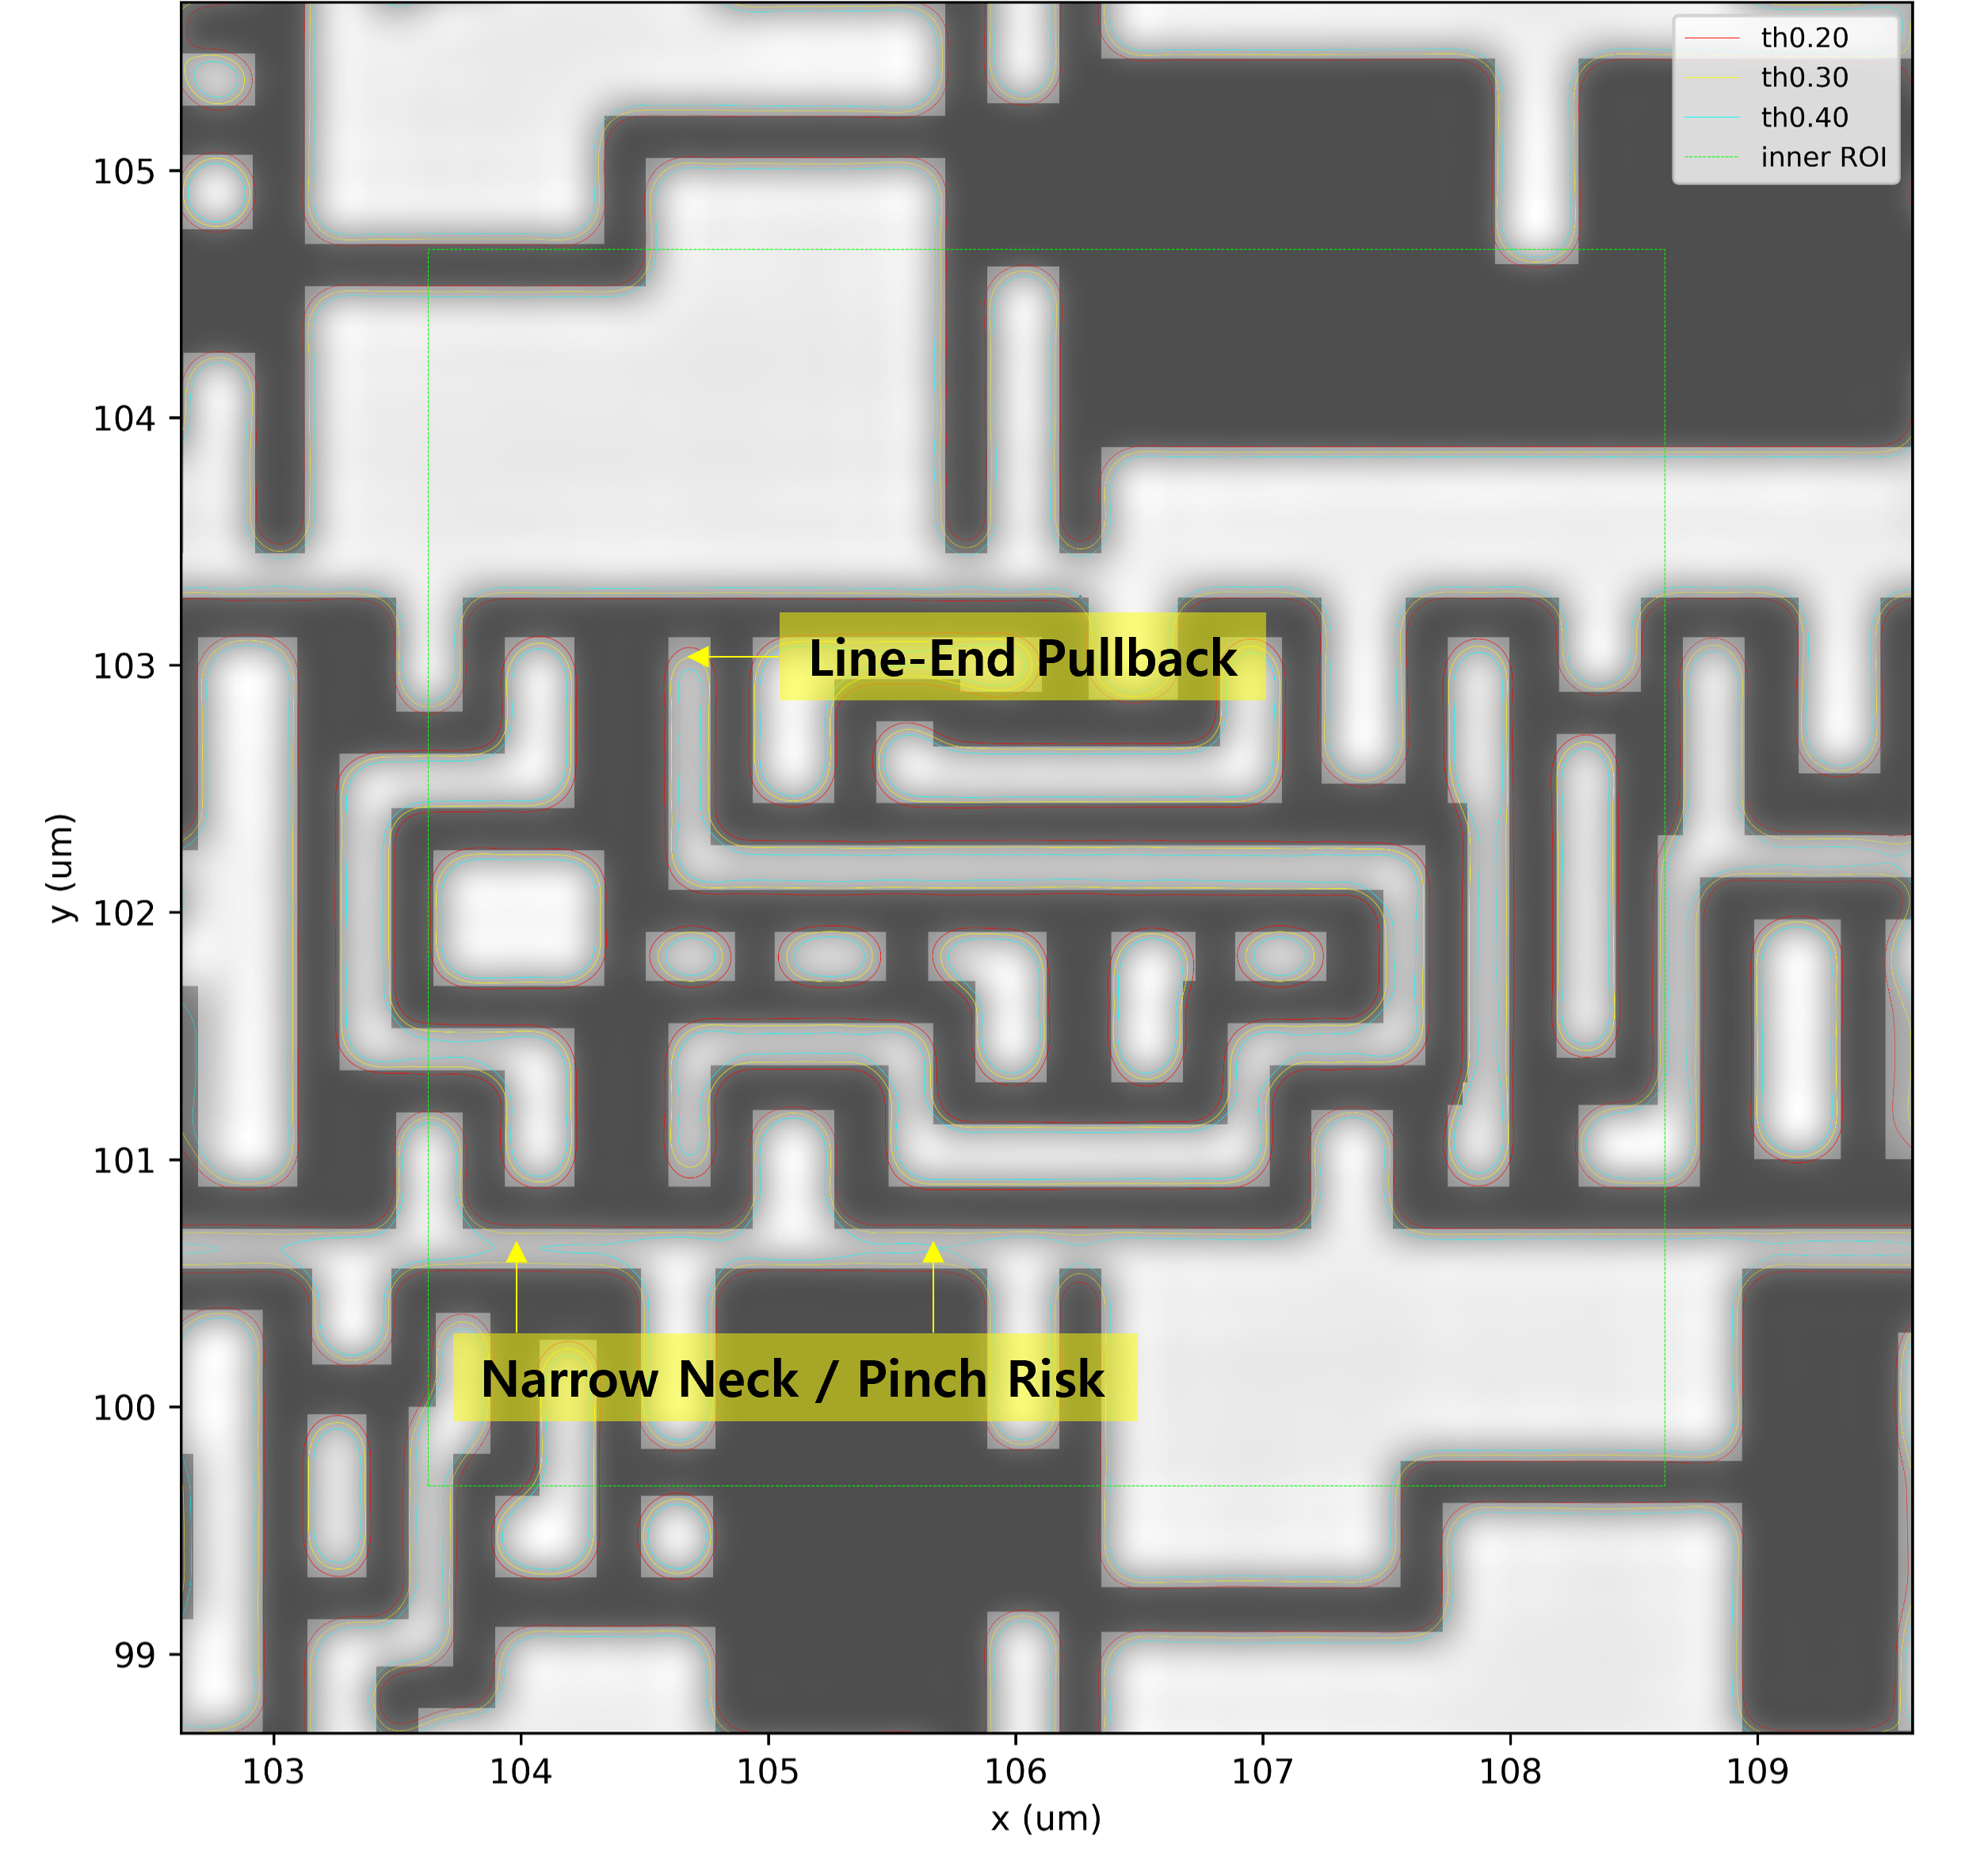
Representative preview showing aerial-image intensity, multi-threshold contours, ROI marker, and hotspot-like interpretation on a public GDS layout.
1. What is GeoSignal Preview?
GeoSignal Preview is a technical demo for visually exploring how layout geometry appears as optical response after passing through a simplified optical model. It is based on public GDS or synthetic layout examples.
The basic workflow is:
layout geometry
    → rasterized mask
    → simplified aerial image
    → threshold contour
    → hotspot candidate visualization
This page introduces the overall workflow of GeoSignal Preview and provides links to demo results, method explanations, and technical notes.
The goal is not precise process prediction. Instead, GeoSignal Preview focuses on one central question:
How does a pattern that looks simple from a geometry viewpoint appear from an optical response viewpoint?
In particular, this preview helps visualize edge rounding-like response, line-end pullback-like response, necking-like response, bridge-like response, and the difference between mask geometry and threshold contour behavior.
2. Motivation
Geometry-based analysis, such as minimum width, minimum space, and density check, is useful for understanding layout patterns. However, geometry checks alone do not always make it easy to intuitively understand how a pattern may appear from an optical imaging perspective.
GeoSignal Preview explores this gap by converting layout polygons into a binary mask image, generating an aerial image with a simplified optical model, extracting threshold contours, and comparing geometry-based candidates with optical response at the ROI level.
Through this workflow, the relationship between layout geometry and optical response can be reviewed quickly using image-based visualization.
3. Preview Structure
GeoSignal Preview is organized around the following pages.
| Page | Description |
|---|---|
| Demo | Demo images and result interpretation |
| Method | Simplified method and workflow explanation |
| Technical Notes | Related technical notes |
Demo
The Demo page shows mask images, aerial images, and threshold contour overlay results based on public or synthetic layout examples.
Main visual materials include:
- mask image
- aerial image
- mask + aerial image overlay
- mask + aerial image + contour overlay
- threshold comparison
- hotspot candidate ROI visualization
Method
The Method page explains the calculation flow used in GeoSignal Preview.
Main topics include:
- candidate ROI selection
- polygon rasterization
- binary mask generation
- simplified Abbe-based imaging
- source point sampling
- pupil filtering
- threshold contour extraction
- comparison between mask and contour behavior
- hotspot candidate review
Technical Notes
Technical Notes provide supporting explanations for understanding the demo and method pages.
Example topics include:
- basic interpretation of aerial image and threshold contour
- qualitative influence of source sampling and optical parameters
- comparison viewpoint between geometry candidates and optical response
- Fourier optics and Abbe imaging background
4. What You Can Review in the Demo
The demo is not intended to claim production-level accuracy. Instead, it is intended to show intuitively how layout patterns may appear differently after passing through a simplified optical model.
The demo helps review questions such as:
- Does a pattern that looks relatively simple in geometry become more sensitive in optical response?
- Can edge rounding, necking, or bridge-like response be observed in threshold contours?
- Do geometry-based candidates and optical-response-based candidates point to the same locations?
- Does threshold comparison help reveal contour sensitivity?
- Which visualization method is most helpful for understanding layout risk?
The demo should be understood as a qualitative review workflow rather than a calibrated lithography verification result.
5. Method Overview
The basic workflow of GeoSignal Preview is:
1. Load layout example
2. Select region of interest
3. Rasterize layout polygon into binary mask
4. Generate aerial image using simplified optical model
5. Extract threshold contours from aerial image
6. Overlay mask, aerial image, and contour
7. Compare threshold-dependent contour behavior
8. Review hotspot candidate behavior
The current preview is based on a simplified Abbe-based imaging model. The calculation includes wavelength, numerical aperture, pupil function, source point sampling, threshold level, pixel size, and ROI size.
Illumination is approximated by sampling multiple source points. For the current demo, the condition is selected by considering the balance between intuitive visual output and computational cost.
More details are described on the Method page.
6. Interpretation and Limitations
The results of GeoSignal Preview are intended for qualitative visualization and relative comparison.
They should be interpreted as a visual analysis aid for understanding the relationship between layout geometry and optical response, not as a definitive answer or production specification.
Current assumptions and limitations are:
- public or synthetic layout examples are used
- a simplified optical model is used
- wafer-data-based calibration is not included
- resist / etch models are not included
- threshold contours are used for qualitative visualization and relative comparison
- results should be interpreted as qualitative indicators, not quantitative CD prediction
- core implementation code is not included in this public preview repository
7. Intended Use
GeoSignal Preview is a visual analysis aid for lightly reviewing lithography-aware layout behavior using public GDS or synthetic patterns.
It may be useful for university labs, student projects, educational researchers, or small technical teams that want to perform early research, learning, or qualitative comparison without directly relying on high-cost commercial simulation environments.
Main intended uses include:
- computational lithography study
- understanding the relationship between layout geometry and optical response
- reviewing public or synthetic pattern-based demos
- reviewing aerial image and threshold contour-based visualization
- understanding the connection between geometry checks and optical models
- reviewing hotspot candidate visualization ideas
8. Feedback
GeoSignal Preview is currently an early public preview.
If you have feedback, questions, or suggestions, please feel free to leave a comment through the feedback form.
Share feedback through the GeoSignal Preview form
Useful feedback includes:
- which part of the demo was easy or difficult to understand
- whether the mask / aerial image / contour comparison is useful
- whether threshold comparison helps understand contour sensitivity and layout risk
- whether this type of lithography-aware hotspot review looks relevant to your work
- which method topics need more explanation
- what kind of additional layout example would make the preview clearer
Any feedback is welcome, even if it is a short comment, question, or impression.
9. Data and Example Policy
GeoSignal Preview is based on public datasets, synthetic patterns, and open-source layout examples.
The analysis workflow is implemented using Python-based open-source libraries and is organized around publicly shareable examples and result interpretation.
Core implementation code is not included in this public preview repository.
Keywords
Lithography · Layout Analysis · GDS · Aerial Image · Threshold Contour · Hotspot Candidate · Python · gdstk · Computational Lithography